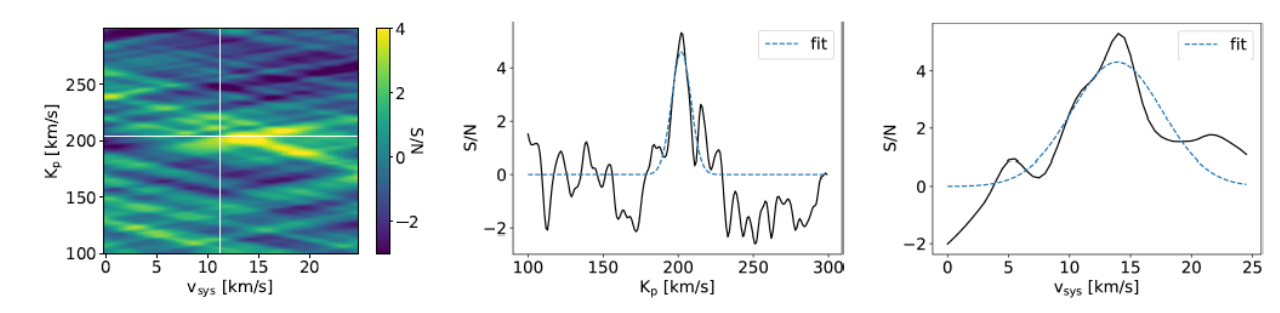
Atmospheric planetary signal obtained with the Ti I template. The left column shows the Kp–vsys bi-dimensional map, with the color bar encoding the significance of the detection. The cross in white dashes marks the position where the planetary signal is expected. The central (right) column shows the cut along the vertical (horizontal) direction in the map and corresponding to the peak detection, together with its gaussian best fit (blue dashed line).