Spectrograph: Steady state (permanently mounted).
PFU: Steady state (permanently mounted).
Polarimeters: Steady state (exchanging with MODS).
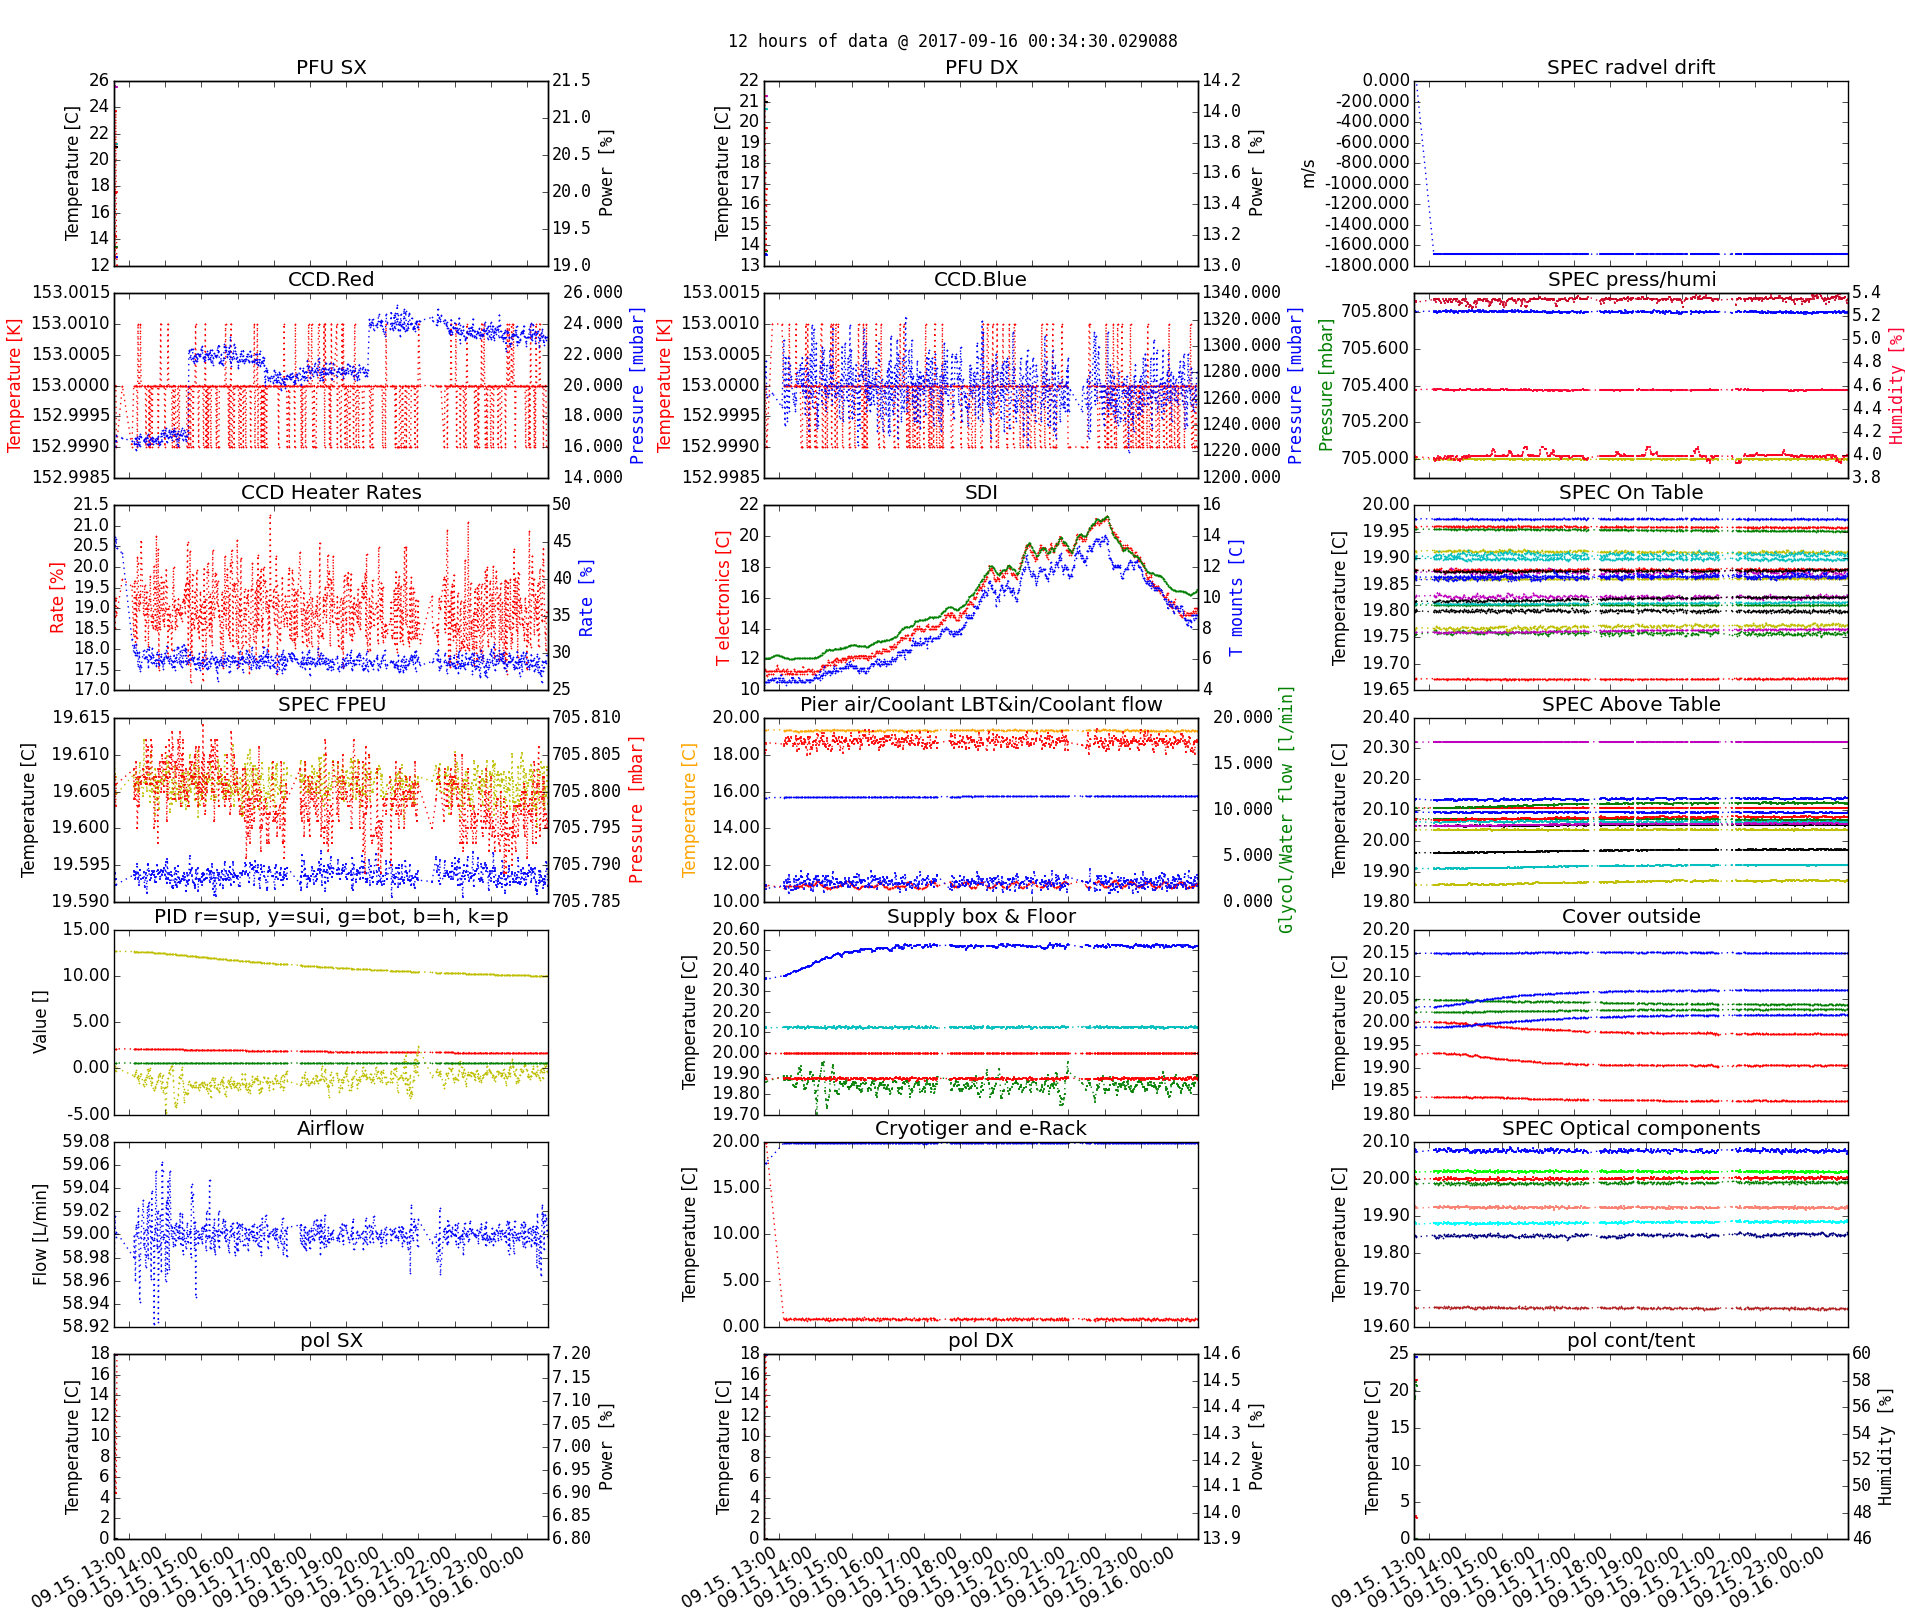
Sensor feeds from the spectrograph and utilities

This shows the values from some selected sensors from the last 12 hours.

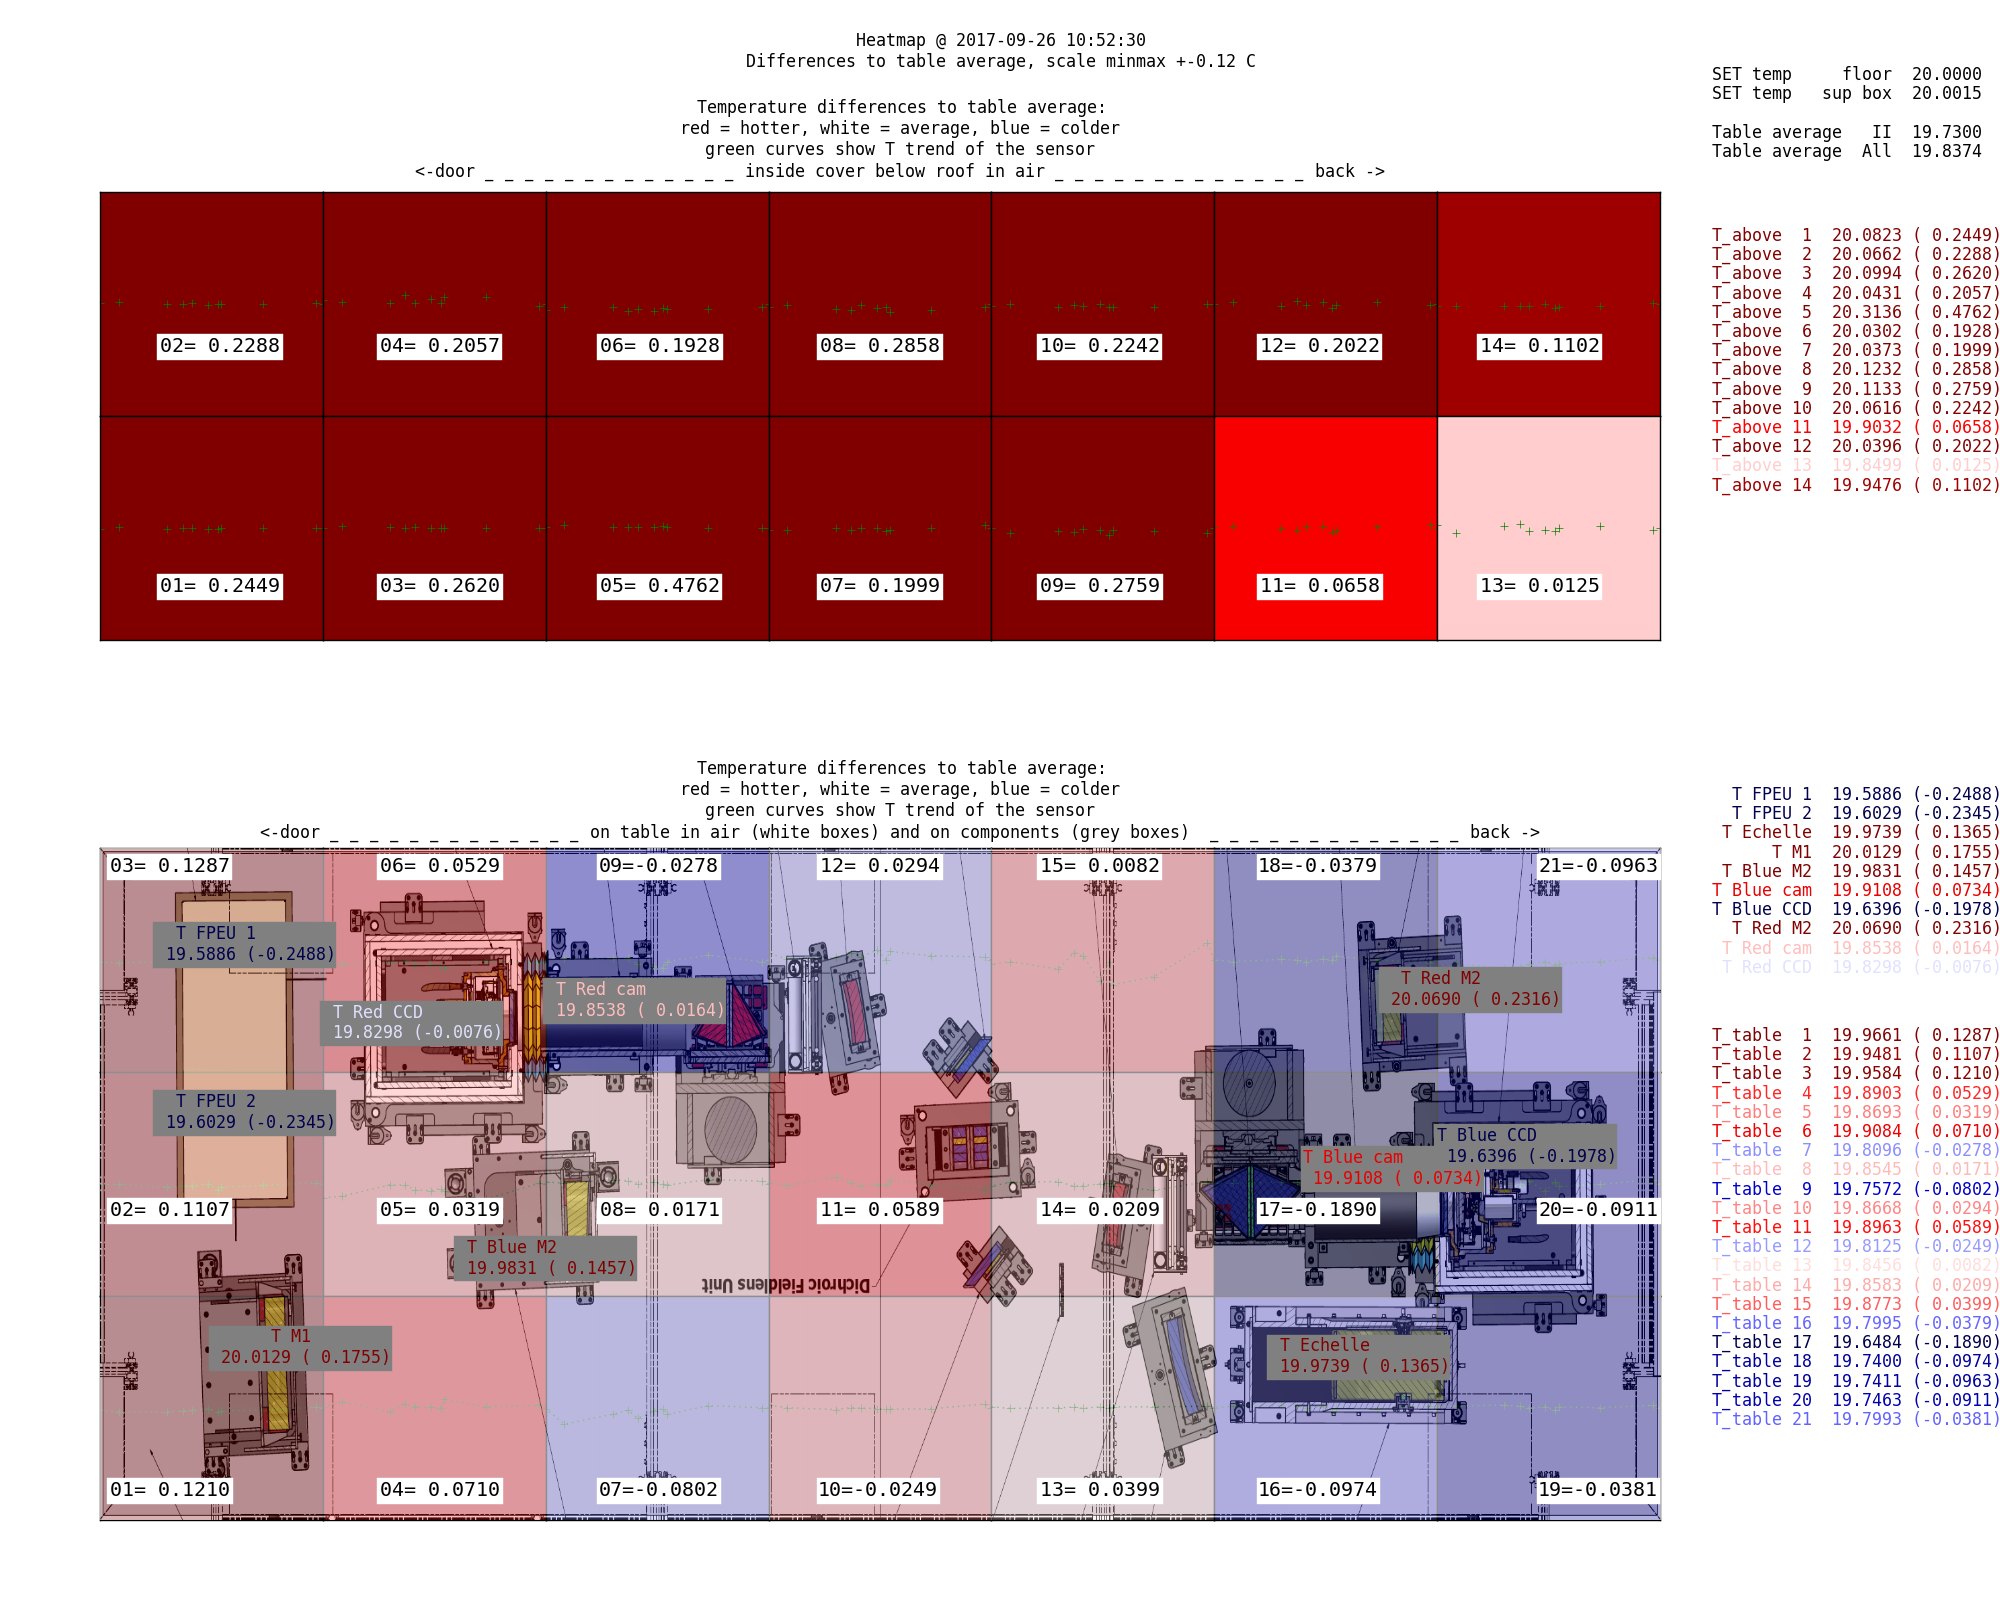
A more visual representation of the temperatures under the cover inside the spectrograph chamber is a heat map. Here a red-to-blue colour scheme depicts warmer areas with red and cooler with blue colours. The maximum colour depth is reached at 0,125 degrees difference to the average table temperature. Upper picture shows the temperatures just under the roof of the cover, about 90cm above the table surface. Lower picture overlays the sensor positions (white) with the optical components and their temperatures (grey).

