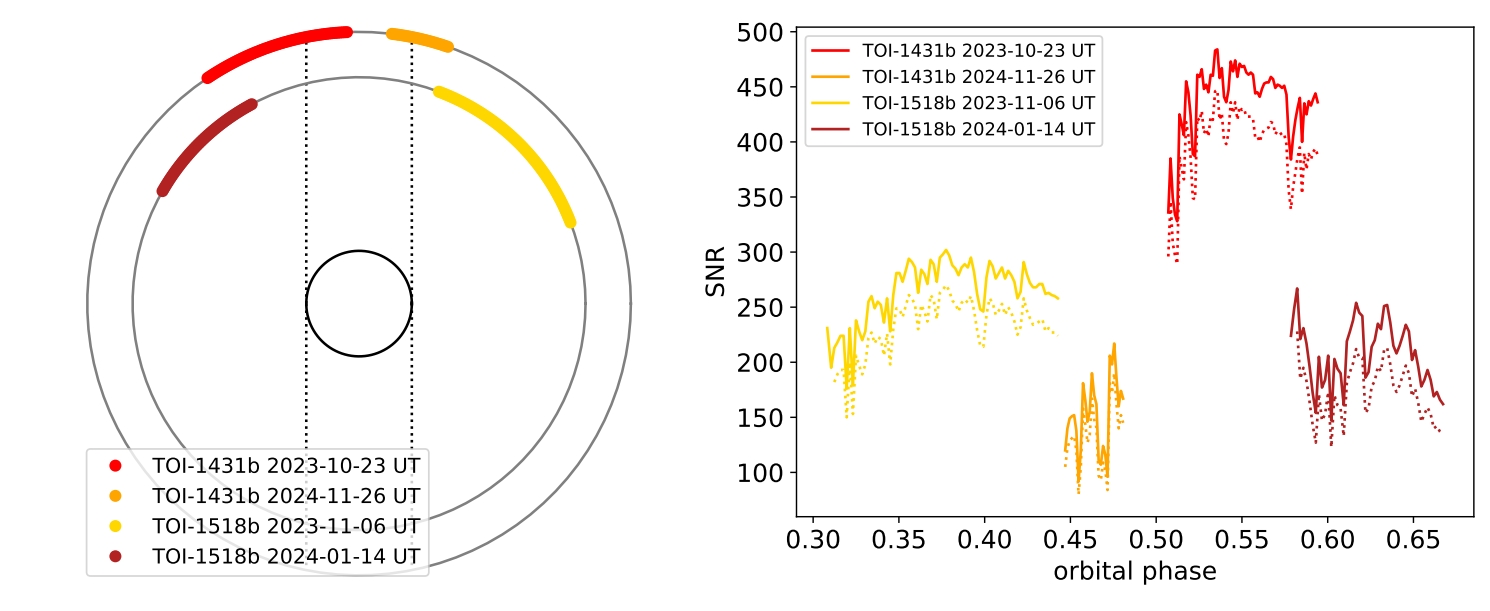
We present high-resolution optical emission spectroscopy observations of the ultra hot Jupiters (UHJs) TOI-1431b and TOI-1518b using the PEPSI spectrograph on the LBT. We detect emission lines from Fe I with a significance of 5.68σ and 7.68σ for TOI 1431b and TOI-1518b, respectively. We also tentatively detect Cr I emission from TOI-1431b at 4.32σ. For TOI-1518 b, we tentatively detect Ni I, Fe II, and Mg I at significance levels ranging from 3−4σ. Detection of emission lines indicates that both planets possess temperature inversions in their atmospheres, providing further evidence of the ubiquity of stratospheres among UHJs. By analyzing the population of hot Jupiters, we compare models that predict the distribution of planets in the temperature-gravity space, and find a recent global circulation model suite from Roth et al. (2024) provides a reasonable match to the observed onset of inversions at Teq∼2000 K. The ubiquity of strong Fe I emission lines among UHJs, together with the paucity of detections of TiO, suggest that atomic iron is the dominant optical opacity source in their atmospheres and can be responsible for the inversions.

Read more: Petz et al. 2025, AJ, in press; arXiv
