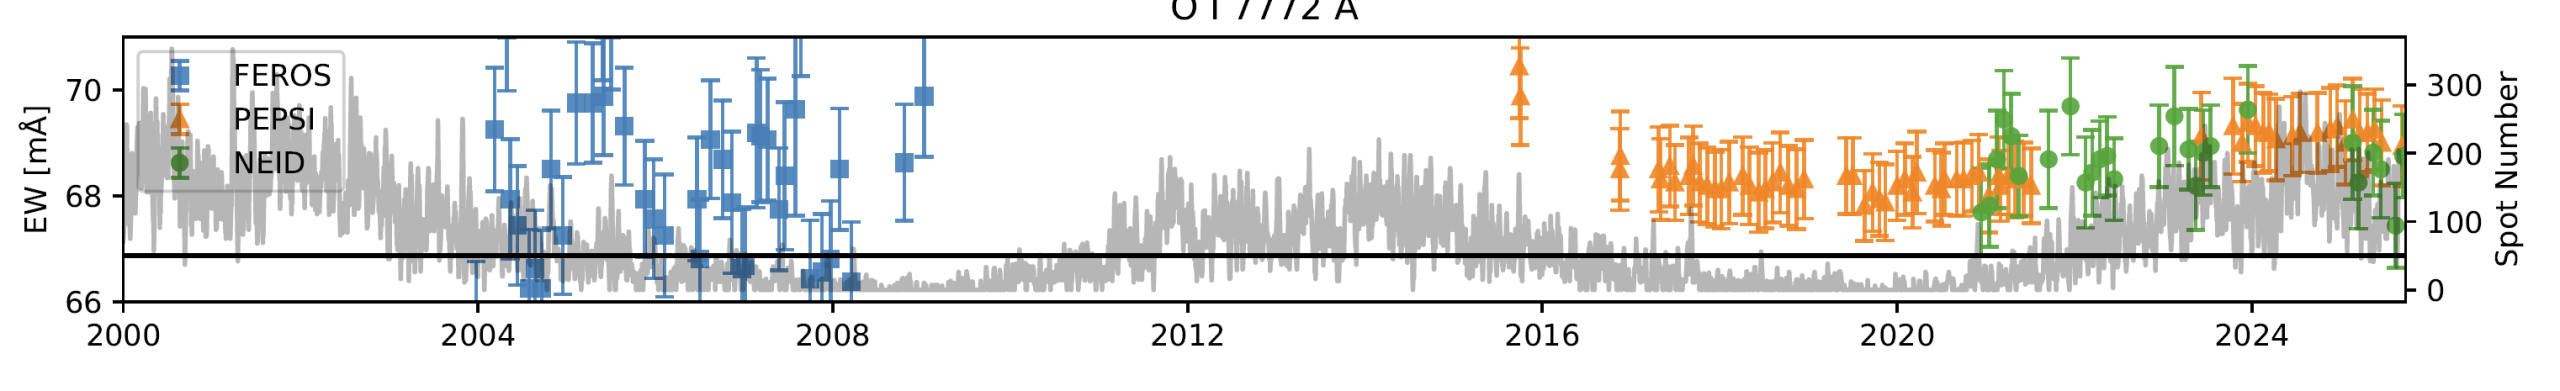
VPNEP: Detailed characterization of TESS targets around the Northern Ecliptic Pole

We embarked on a high-resolution optical spectroscopic survey of bright Transiting Exoplanet Survey Satellite (TESS) stars around the Northern Ecliptic Pole (NEP), dubbed the Vatican-Potsdam-NEP (VPNEP) survey. Our NEP coverage comprises 1067 stars, of which 352 are bona fide dwarf stars and 715 are giant stars, all cooler than spectral type F0 and brighter than V=8.5. Our aim is to characterize these stars for the benefit of future studies in the community. We analyzed the spectra via comparisons with synthetic spectra. Particular line profiles were analyzed by means of eigen-profiles, equivalent widths, and relative emission-line fluxes (when applicable). Two R=200 000 spectra were obtained for each of the dwarf stars with the Vatican Advanced Technology Telescope (VATT) and the Potsdam Echelle Polarimetric and Spectroscopic Instrument (PEPSI), with typically three R=55 000 spectra obtained for the giant stars with STELLA and the STELLA Echelle Spectrograph (SES). Combined with V-band magnitudes, Gaia eDR3 parallaxes, and isochrones from the Padova and Trieste Stellar Evolutionary Code, the spectra can be used to obtain radial velocities, effective temperatures, gravities, rotational and turbulence broadenings, stellar masses and ages, and abundances for 27 chemical elements, as well as isotope ratios for lithium and carbon, line bisector spans, convective blue-shifts (when feasible), and levels of magnetic activity from Halpha, Hbeta, and the Ca II infrared triplet. In this initial paper, we discuss our analysis tools and biases, presenting our first results from a pilot sub-sample of 54 stars (27 bona-fide dwarf stars observed with VATT+PEPSI and 27 bona-fide giant stars observed with STELLA+SES) and making all reduced spectra available to the community.

Data delivery example: 8000-Å CN region of HR 5844. Diamond symbols are the observed spectrum and the lines are fits with three different 12C/13C isotope ratios, using the CN line list of Plez. The best average from eight fits is 12C/13C=17.8 using a relative nitrogen abundance of 0.50±0.05 and a relative iron abundance of –0.25±0.03. Average S/N per pixel of this PEPSI spectrum in this wavelength range is 400.

Read more: Strassmeier et al. 2023, A&A, in press (arXiv:2302.01794)

The PEPSI Exoplanet Transit Survey (PETS). II. A Deep Search for Thermal Inversion Agents in KELT-20 b/MASCARA-2 b with Emission and Transmission Spectroscopy

Recent observations have shown that the atmospheres of ultra hot Jupiters (UHJs) commonly possess temperature inversions, where the temperature increases with increasing altitude. Nonetheless, which opacity sources are responsible for the presence of these inversions remains largely observationally unconstrained. We used LBT/PEPSI to observe the atmosphere of the UHJ KELT-20 b in both transmission and emission in order to search for molecular agents which could be responsible for the temperature inversion. We validate our methodology by confirming previous detections of Fe I in emission at 16.9 σ. Our search for the inversion agents TiO, VO, FeH, and CaH results in nondetections. Using injection-recovery testing we set 4σ upper limits upon the volume mixing ratios for these constituents as low as ∼1×10⁻⁹ for TiO. For TiO, VO, and CaH, our limits are much lower than expectations from an equilibrium chemical model, while we cannot set constraining limits on FeH with our data. We thus rule out TiO and CaH as the source of the temperature inversion in KELT-20 b, and VO only if the line lists are sufficiently accurate.

Shifted and combined CCFs for emission from Fe I. We detect the Fe I emission at a significance of 16.9σ, reproducing previous results. We were able to recover the signal near the expected planetary radial velocity. Yan et al. (2022b) obtained a 7.7σ detection, and Borsa et al. (2022) at 7.1σ with the Calar Alto 3.5m and the TNG 3.6m, respectively.

Read more: Marshall et al. 2023, AJ, in press (arXiv:2205.12162)

Untangling the Sources of Abundance Dispersion in Low-Metallicity Stars

We measured abundances of 12 elements (Na, Mg, Si, Ca, Sc, Ti, V, Cr, Mn, Fe, Co, Ni) in a sample of 86 metal-poor subgiant stars in the solar neighborhood. Abundances are derived from high-resolution spectra taken with the Potsdam Echelle Polarimetric and Spectroscopic Instrument on the Large Binocular Telescope, modeled using iSpec and MOOG. By carefully quantifying the impact of photon-noise (< 0.05 dex for all elements) we robustly measure the intrinsic scatter of abundance ratios. At fixed [Fe/H] the RMS intrinsic scatter in [X/Fe] ranges from 0.04 dex (Cr) to 0.16 dex (Na), with a median of 0.08 dex. Scatter in [X/Mg] is similar, and accounting for [alpha/Fe] only reduces the overall scatter moderately. We consider several possible origins of the intrinsic scatter with particular attention to fluctuations in the relative enrichment by core-collapse supernovae (CCSN) and Type Ia supernovae (SNIa) and stochastic sampling of the CCSN progenitor mass distribution. The stochastic sampling scenario provides a good quantitative explanation of our data if the effective number of CCSN contributing to the enrichment of a typical sample star is N approx 50. At the median metallicity of our sample, this interpretation implies that the CCSN ejecta are mixed over a gas mass 10^5 MSun before forming stars. The scatter of elemental abundance ratios is a powerful diagnostic test for simulations of star formation, feedback, and gas mixing in the early phases of the Galaxy.

Spectral section from 5495−5535 A of three stars with [Fe/H] near −2 (green), −1.5 (blue), and −1.0 (purple). Line features for Fe I, Ti I, Ca II, Sc II, and Mg I are labeled. Fluxes are normalized, with the [Fe/H] ≈ −1.5 spectrum offset by 0.5 and the [Fe/H] ≈ −2 spectrum offset by 1.

Read more:  Griffith et al. 2022, ApJ, in press  (arXiv:2210.01821)

Io’s Optical Aurorae in Jupiter’s Shadow

Recent studies have established that the majority of Io’s molecular atmosphere, SO2 and SO, condenses during its passage through Jupiter’s shadow. The eclipse response of Io’s atomic atmosphere is less certain, having been characterized solely by ultraviolet aurorae. Here we explore the response of optical aurorae for the first time. We find oxygen to be indifferent to the changing illumination with [O I] brightness merely tracking the plasma density at Io’s position in the torus. In shadow, line ratios confirm sparse SO2 coverage relative to O since their collisions would otherwise quench the emission. Io’s sodium aurora mostly disappears in eclipse and e-folding timescales for decline and recovery differ sharply: ~10 minutes at ingress and nearly 2 hours at egress. Only ion chemistry can produce such a disparity; Io’s molecular ionosphere is much weaker at egress due to rapid recombination. Auroral emission is also evident from potassium, confirming K as the major source of far red emissions seen in situ. In all cases, direct electron impact on atomic gas is sufficient to explain the brightness without invoking significant dissociative excitation of molecules. The non-response of O and rapid depletion of Na during Io’s eclipse phase is surprisingly inverted from the eclipse phase behavior of the SO2 and NaCl parent molecules.

Io’s [O I] 6300 Å line emission amidst Jupiter scattered light on 24 April 2019 with LBT/PEPSI. The red-to-blue color scheme shows elapsed time in shadow. Scattered light levels increase as Io approaches the jovian limb and dotted lines show the fitting of a background spectrum to this component. Lower panel shows the residual after scattered light subtraction. Gaussians are fit to Io’s emission line, which Doppler shifts slightly in time. The observing geometry for the LBT/PEPSI observations is shown on the left panel.

Read more: Schmidt et al. 2022, PSJ, in press (AAS Planetary Science Journal)

On the lithium abundance of the visual binary components ksi Boo A (G8V) and ksi Boo B (K5V)

A spectroscopic investigation of the lithium resonance doublet in ξ Boo A and ξ Boo B in terms of both abundance and isotopic ratio is presented. We obtained new R=130 000 spectra with a signal-to-noise ratio (S/N) per pixel of up to 3200 using the 11.8m LBT and PEPSI. From fits with synthetic line profiles based on 1D-LTE MARCS model atmospheres and 3D-NLTE corrections, we determine the abundances of both isotopes. For ξ Boo A, we find A(Li) = 2.40±0.03 dex and 6Li/7Li < 1.5±1.0 % in 1D LTE, which increases to ≈2.45 for the 3D-NLTE case. For ξ Boo B we obtain A(Li) = 0.37±0.09 dex in 1D-LTE with an unspecified 6Li/7Li level. Therefore, no 6Li is seen on any of the two stars. We consider a spot model for the Li fit for ξ Boo B and find A(Li) = 0.45±0.09 dex. The 7Li abundance is 23 times higher for ξ Boo A than the Sun’s, but three times lower than the Sun’s for ξ Boo B while both fit the trend of single stars in the similar-aged M35 open cluster. Effective temperatures are redetermined from the TiO band head strength. We note that the best-fit global metallicities are –0.13±0.01 dex for ξ Boo A but +0.13±0.02 dex for ξ Boo B. Lithium abundance for the K5V benchmark star 61 Cyg A was obtained to A(Li)≈0.53 dex when including a spot model but to ≈0.15 dex without a spot model.

Lithium 6708 Å of ξ Boo A (black dots) and ξ Boo B (red dots). The wavelengths of the two doublets from the two lithium isotopes are marked as vertical lines. Also indicated are the blending features from the line list of Meléndez et al. (2012). Additional molecular features from the sunspot umbral spectrum of Wallace et al. (1999) are indicated as well.

Read more: Strassmeier & Steffen 2022, AN, 343, article id. e20220036

The recurrent nova V3890 Sgr: a near-infrared and optical study of the red giant component and its environment

We present an analysis of the red giant component of the recurrent nova V3890 Sgr, using data obtained before and after its 2019 eruption. Its effective temperature is Teff = 3050 ± 200 K for log g = 0.7, although there are modest changes in Teff. There is an overabundance of both carbon (0.20 ± 0.05 dex) and sodium (1.0 ± 0.3 dex) relative to their solar values, possibly the result of ejecta from the 1990 nova eruption being entrained into the red giant photosphere. We find 12C/13C =25 ± 2, a value similar to that found in red giants in other recurrent novae. The spectrum in the region of the Na I D lines is complex, and includes at least six interstellar components, together with likely evidence for interaction between ejecta from the 2019 eruption and material accumulated in the plane of the binary.

PEPSI (R = 130, 000) observed velocity profiles of various strong emission lines in V3890 Sgr post the 2019 RN eruption at a phase of 0.709. Top: Hα and Hβ. Middle: Permitted lines of He I 5875Å, 6678Å, and the forbidden O III 5006Å line. Bottom: The region of the Na I D lines, for which the velocities are calculated with respect to the D2 line (5889.995Å air). The two narrow features marked by the blue circles are night sky sodium lines. Velocity components of various absorption features are indicated. Note that there are only three distinct Na I D absorption systems: the features at −110.21 km/s and −190.47 km/s are from the same systems as those at +112 km/s and +193 km/s, but for D1.

Read more: Kaminsky et al. 2022, MNRAS, 517, 6064

Characterization of chromospheric activity based on Sun‑as‑a‑star spectral and disk‑resolved activity indices

The strong chromospheric absorption lines Ca H & K are tightly connected to stellar surface magnetic fields. Only for the Sun, spectral activity indices can be related to evolving magnetic features on the solar disk. The Solar Disk-Integrated (SDI) telescope feeds the Potsdam Echelle Polarimetric and Spectroscopic Instrument (PEPSI) of the Large Binocular Telescope (LBT) at Mt. Graham International Observatory (MGIO), Arizona, U.S.A. We present high-resolution, high-fidelity spectra that were recorded on 184 & 82 days in 2018 & 2019 and derive the Ca H & K emission ratio, i.e., the S-index. In addition, we compile excess brightness and area indices based on full-disk Ca K line-core filtergrams of the Chromospheric Telescope (ChroTel) at Observatorio del Teide, Tenerife, Spain and full-disk ultraviolet (UV) 1600 Å images of the Atmospheric Imaging Assembly (AIA) on board the Solar Dynamics Observatory (SDO). Thus, Sun-as-a-star spectral indices are related to their counterparts derived from resolved images of the solar chromosphere. All indices display signatures of rotational modulation, even during the very low magnetic activity in the minimum of Solar Cycle 24. Bringing together different types of activity indices has the potential to join disparate chromospheric datasets, yielding a comprehensive description of chromospheric activity across many solar cycles.

(a) Average Ca II H & K spectrum computed from 60 consecutive exposures obtained by PEPSI/SDI on June 21, 2018. Details of the line fitting procedure are shown in the ±1.2 Å range around the cores of (b) the Ca II K and (c) the Ca II H chromospheric absorption lines.

Read more: Dineva et al. 2022, AN 343, article id e23996

The Origin of Weakened Magnetic Braking in Old Solar Analogs

The rotation rates of main-sequence stars slow over time as they gradually lose angular momentum to their magnetized stellar winds. The rate of angular momentum loss depends on the strength and morphology of the magnetic field, the mass-loss rate, and the stellar rotation period, mass, and radius. Previous observations suggested a shift in magnetic morphology between two F-type stars with similar rotation rates but very different ages (88 Leo and ρ CrB). In this Letter, we identify a comparable transition in an evolutionary sequence of solar analogs with ages between 2–7 Gyr. We present new spectropolarimetry of 18 Sco and 16 Cyg A & B from the Large Binocular Telescope, and we reanalyze previously published Zeeman Doppler images of HD 76151 and 18 Sco, providing additional constraints on the nature and timing of this transition.

Stokes V circular polarization profiles for 18 Sco (left) and 16 Cyg A & B (right) from LBT PEPSI observations in 2021 May. Mean profiles are shown as black lines, while uncertainties are indicated with gray shaded areas. Colored lines show axisymmetric model profiles assuming dipole (blue), quadrupole (red), or octupole (magenta) geometry with fixed inclination.

Read more: Metcalfe et al. 2022, ApJ Letter, 933, 17; arXiv 2206.08540

An Aligned Orbit for the Young Planet V1298 Tau b

The alignment of planetary orbits with respect to the stellar rotation preserves information on their dynamical histories. Measuring this angle for young planets helps illuminate the mechanisms that create misaligned orbits for older planets, as different processes could operate over timescales ranging from a few megayears to a gigayear. We present spectroscopic transit observations of the young exoplanet V1298 Tau b; we update the age of V1298 Tau to be 28 ± 4 Myr based on Gaia EDR3 measurements. We observed a partial transit with Keck/HIRES and LBT/PEPSI, and detected the radial velocity anomaly due to the Rossiter-McLaughlin effect. V1298 Tau b has a prograde, well-aligned orbit, with λ=4+7−10 deg. By combining the spectroscopically measured vsini⋆ and the photometrically measured rotation period of the host star we also find that the orbit is aligned in 3D, ψ=8+4−7 deg. Finally, we combine our obliquity constraints with a previous measurement for the interior planet V1298 Tau c to constrain the mutual inclination between the two planets to be i mut = 0° ± 19°.

Doppler tomographic data from PEPSI (top three panels) and HIRES (bottom). All plots show the time-series line profile residuals, i.e., each horizontal line shows the deviation of the line profile from the average line profile at that time. Time increases from bottom to top; units are such that ingress = 0 and egress = 1. The vertical dotted lines show v = 0, ±$v sin i_star, the horizontal dotted line the time of mid-transit, and the two small plus signs first and second contact. In the HIRES plot we also show two slanted dotted lines to guide the eye along the spot signatures, which are less obvious than in the PEPSI data.

Read more:  Johnson et al. 2022, AJ, 163, 247

The PEPSI exoplanet transit survey (PETS) I: Investigating the presence of a silicate atmosphere on the super-earth 55 Cnc e

The study of exoplanets and especially their atmospheres can reveal key insights on their evolution by identifying specific atmospheric species. For such atmospheric investigations, highresolution transmission spectroscopy has shown great success, especially for Jupitertype planets. Towards the atmospheric characterization of smaller planets, the superEarth exoplanet 55 Cnc e is one of the most promising terrestrial exoplanets studied to date. Here, we present a highresolution spectroscopic transit observation of this planet, acquired with the PEPSI instrument at the Large Binocular Telescope. Assuming the presence of Earthlike crust species on the surface of 55 Cnc e, from which a possible silicatevapor atmosphere could have originated, we search in its transmission spectrum for absorption of various atomic and ionized species such as Fe , Fe +, Ca , Ca +, Mg and K , among others. Not finding absorption for any of the investigated species, we are able to set absorption limits with a median value of 1.9 × RP. In conclusion, we do not find evidence of a widely extended silicate envelope on this superEarth reaching several planetary radii.

2D maps of the residual spectra at different orbital phases in the velocity range for strong opacity bearing species i.e. Mg I (top), H beta, and K I (center) and Ca II (bottom). The color bar shows the residual Flux in %. The dashed black line shows the expected absorption trace.

Read more: Keles et al. 2022, MNRAS, 513, 1544