Category Archives: Publications

PEPSI Investigation, Retrieval, and Atlas of Numerous Giant Atmospheres (PIRANGA). I. The Ubiquity of Fe I Emission and Inversions in Ultra Hot Jupiter Atmospheres

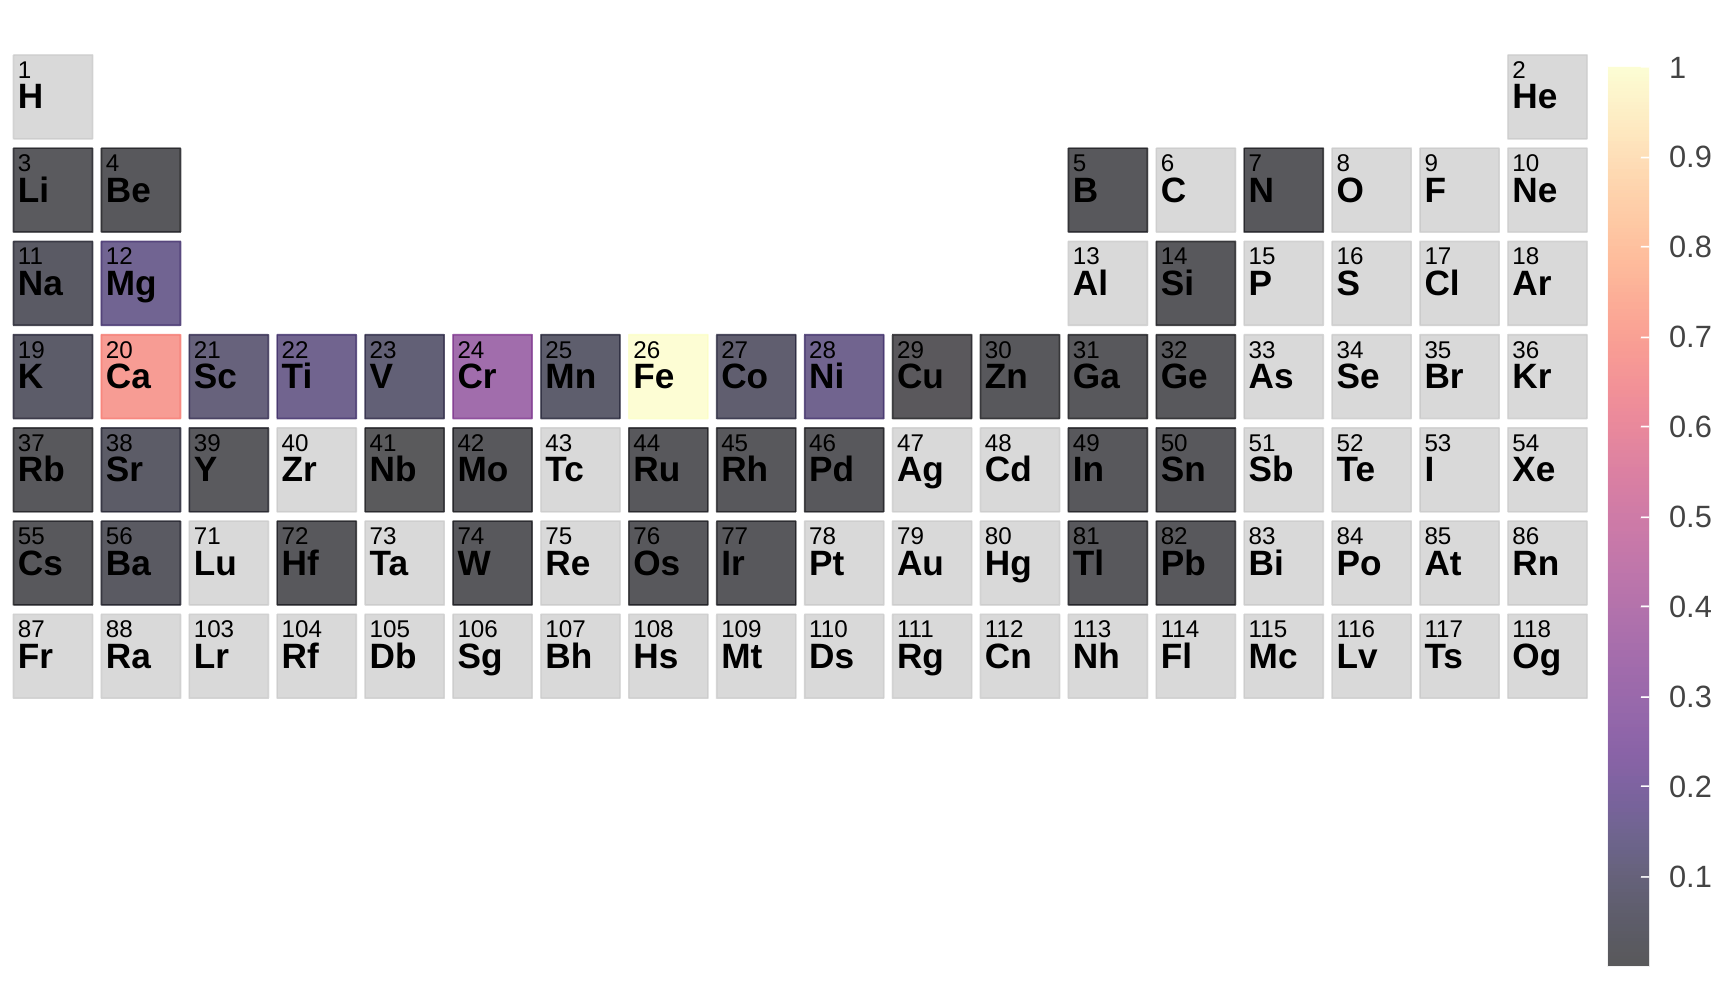
We present high-resolution optical emission spectroscopy observations of the ultra hot Jupiters (UHJs) TOI-1431b and TOI-1518b using the PEPSI spectrograph on the LBT. We detect emission lines from Fe I with a significance of 5.68σ and 7.68σ for TOI 1431b and TOI-1518b, respectively. We also tentatively detect Cr I emission from TOI-1431b at 4.32σ. For TOI-1518 b, we tentatively detect Ni I, Fe II, and Mg I at significance levels ranging from 3−4σ. Detection of emission lines indicates that both planets possess temperature inversions in their atmospheres, providing further evidence of the ubiquity of stratospheres among UHJs. By analyzing the population of hot Jupiters, we compare models that predict the distribution of planets in the temperature-gravity space, and find a recent global circulation model suite from Roth et al. (2024) provides a reasonable match to the observed onset of inversions at Teq∼2000 K. The ubiquity of strong Fe I emission lines among UHJs, together with the paucity of detections of TiO, suggest that atomic iron is the dominant optical opacity source in their atmospheres and can be responsible for the inversions.

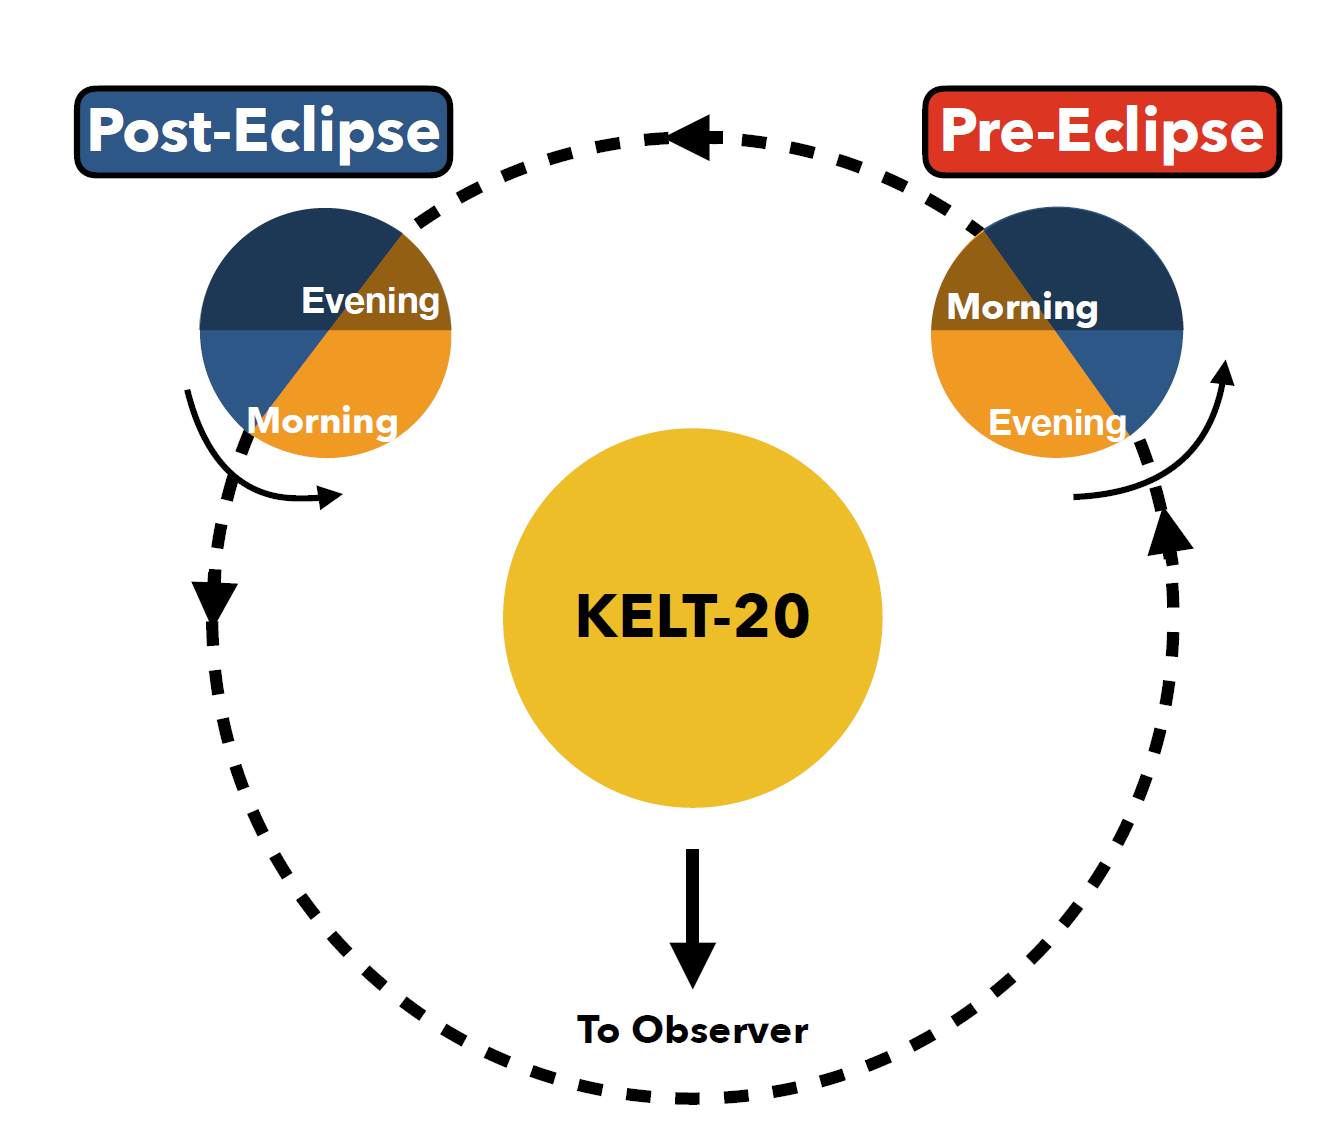
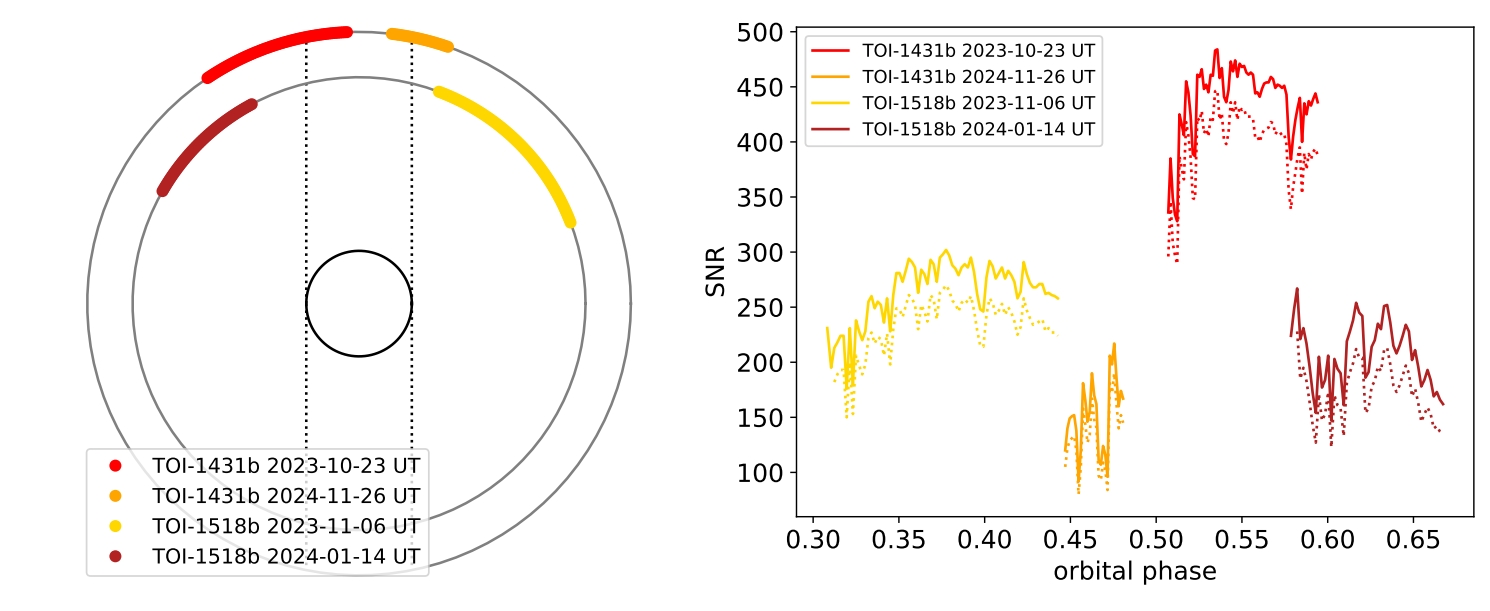
Left: Phase coverage of the observations used in this work. The solid inner circle shows the stellar surface, while the middle and outer circles show the orbits of TOI-1518 b and TOI-1431 b, respectively, to scale. The observer is off the bottom of the page, and the vertical dashed lines show the line of sight, such that transit occurs in the lower intersection of the dashed lines and planetary orbits, and the secondary eclipse in the upper intersection. The planets orbit counter clockwise. The colored points show the portions of the orbit where we obtained data. Right: signal-to-noise ratio of our observations as a function of orbital phase. The PEPSI red and blue arms are shown as the solid and dotted lines, respectively. The SNR values shown are, for each spectrum, the 95th quantile per-pixel signal to-noise ratios.

Read more: Petz et al. 2025, AJ, in press; arXiv

First Doppler image and starspot-corrected orbit for lambda Andromedae

Starspots on a rotating stellar surface impact the measured radial velocities and thereby limit the determination of precise orbital elements as well as astrophysical stellar parameters and even jeopardize the detection and characterization of (exo)planets. Phase-resolved high resolution optical spectra from PEPSI and STELLA were recorded over the course of 522 days in 2021-2022. Doppler imaging is used to reconstruct λ And’s starspots with very high resolution (R = 250 000) and high signal-to-noise ratio PEPSI spectra. The Doppler image reconstructs a dominating cool spot with an umbral temperature difference of ≈1000K with respect to the photosphere of 4660K and is likely surrounded by a moat-like velocity field. Three more weaker spots add to the total surface spottedness, which is up to 25% of the visible surface.

Our Doppler image (panel a) is compared with the RV residuals (panel b) and the chromospheric Ca II IRT (8542 Å) line core flux (panel c). The Doppler image is from PEPSI spectra only and shows four spots, or spotted regions, identified with letters A D. RVs correlate well with the location of the four cool spots and almost anti-correlate with the chromospheric Ca ii IRT emission. The shown RVs and activity data are from the same time-coverage than the Doppler image (May–June 2022).

Read  more: Adebali, et al. 2025, A&A, in press

Testing the Rossby Paradigm: Weakened Magnetic Braking in early K-type Stars

We present new observational constraints on magnetic braking for an evolutionary sequence of six early K-type stars. To determine the wind braking torque for each of our targets, we combine spectropolarimetric constraints on the large-scale magnetic field, Lyα or X-ray constraints on the mass-loss rate, as well as uniform estimates of the stellar rotation period, mass, and radius. As identified previously from similar observations of hotter stars, we find that the wind braking torque decreases abruptly by more than an order of magnitude at a critical value of the stellar Rossby number. Given that all of the stars in our sample exhibit clear activity cycles, we suggest that weakened magnetic braking may coincide with the operation of a subcritical stellar dynamo.

PEPSI Stokes V polarization profile for HD166620 from LBT observations on 2024 July 5. The mean LSD profile is shown as a black line with uncertainties indicated by the gray shaded area.

Read more: Metcalfe et al. 2025 arXiv

PEPSI’s non-detection of escaping hydrogen and metal lines adds to the enigma of WASP-12b

WASP-12 b is an ultra-hot Jupiter (UHJ) of special interest for atmospheric studies since it is on an inspiraling orbit in an extreme environment of intense radiation and circumstellar gas. Previously claimed detections of active mass loss from this planet are controversial across the literature. To address this controversy, we obtained two new transit observations of WASP-12 b with the optical high-resolution PEPSI spectrograph on the Large Binocular Telescope. Contrary to previous work, we do not observe planetary H𝛼 absorption and rule out the amplitude of previously reported detections. Our non-detection may be limited by the sensitivity of our data or could indicate weaker mass loss than suggested by previous studies. We conclude that previous claims of H𝛼 absorption from the atmosphere of WASP-12 b should be reevaluated. Given the anticipated line strength of Balmer/optical features, observing the atmosphere of this faint target will require stacking more observations even with the largest telescope facilities available.

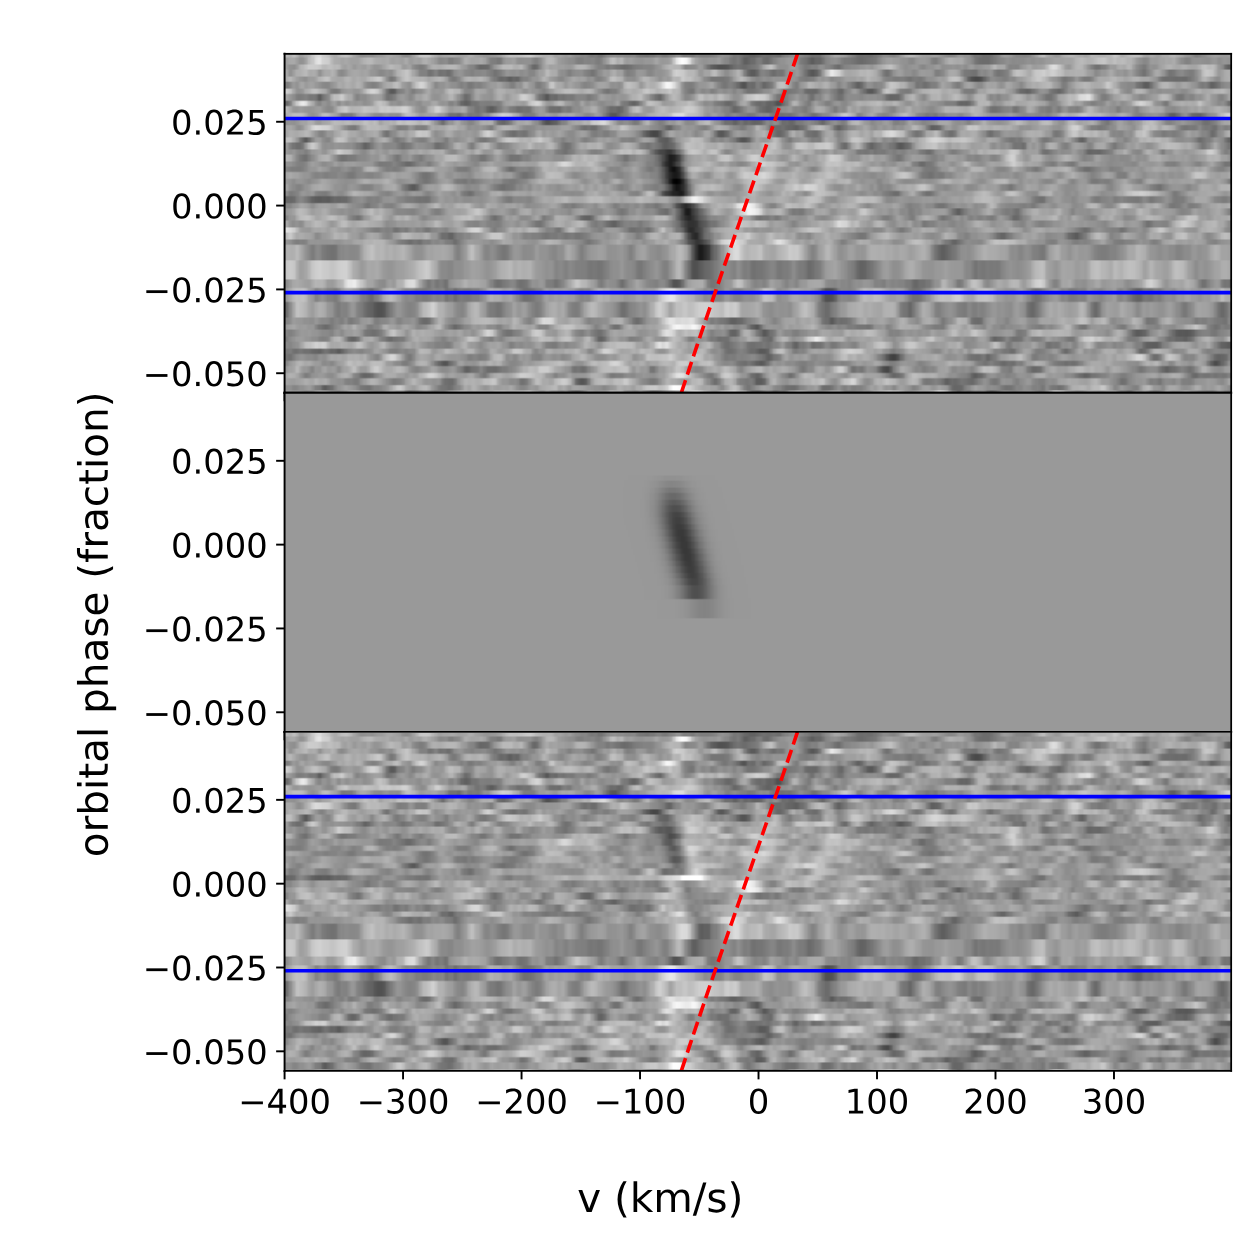
Non-detection of planetary atmospheric absorption around H𝛼 line (6562.83 Å) in Night 1 data. The top panel is the order-stitched, continuum normalized stellar spectra from the PEPSI pipeline where the colorbar represents flux after continuum normalization. The second panel is the spectra with the stellar component removed; red (values greater than zero) indicates excess emission while blue (values less than zero) indicates excess absorption. The third panel shows the spectra from the second panel after applying SYSREM. The fourth and bottom panel displays the difference between the second and third panels.

Read more: Pai Asnodkar et al. 2024, MNRAS, 535, 1829

Sun-as-a-Star Spectroscopic Observations of the 2017 August 21 Solar Eclipse

The solar eclipse of 2017 August 21 was observed with the Potsdam Echelle Polarimetric and Spectroscopic Instrument (PEPSI) on the Large Binocular Telescope (LBT), which is located at Mt. Graham International Observatory (MGIO), Arizona, USA. At this location, a partial eclipse was observed with maximum obscuration of 61.6%. The 11-millimeter-aperture, binocular Solar Disk-Integrated (SDI) telescope, located on the kitchen balcony of the LBT building, feeds sunlight to PEPSI, which has recorded a total of 116 Sun-as-a-star spectra in the wavelength range of 5300 – 6300 Å, with a spectral resolution R=250,000 and S/N of about 733:1. The temporal evolution of the Fraunhofer Na I D doublet at 5890/5896 Å is analyzed using contrast profiles that illustrate subtle changes in the spectral line, not obvious in the intensity profiles.

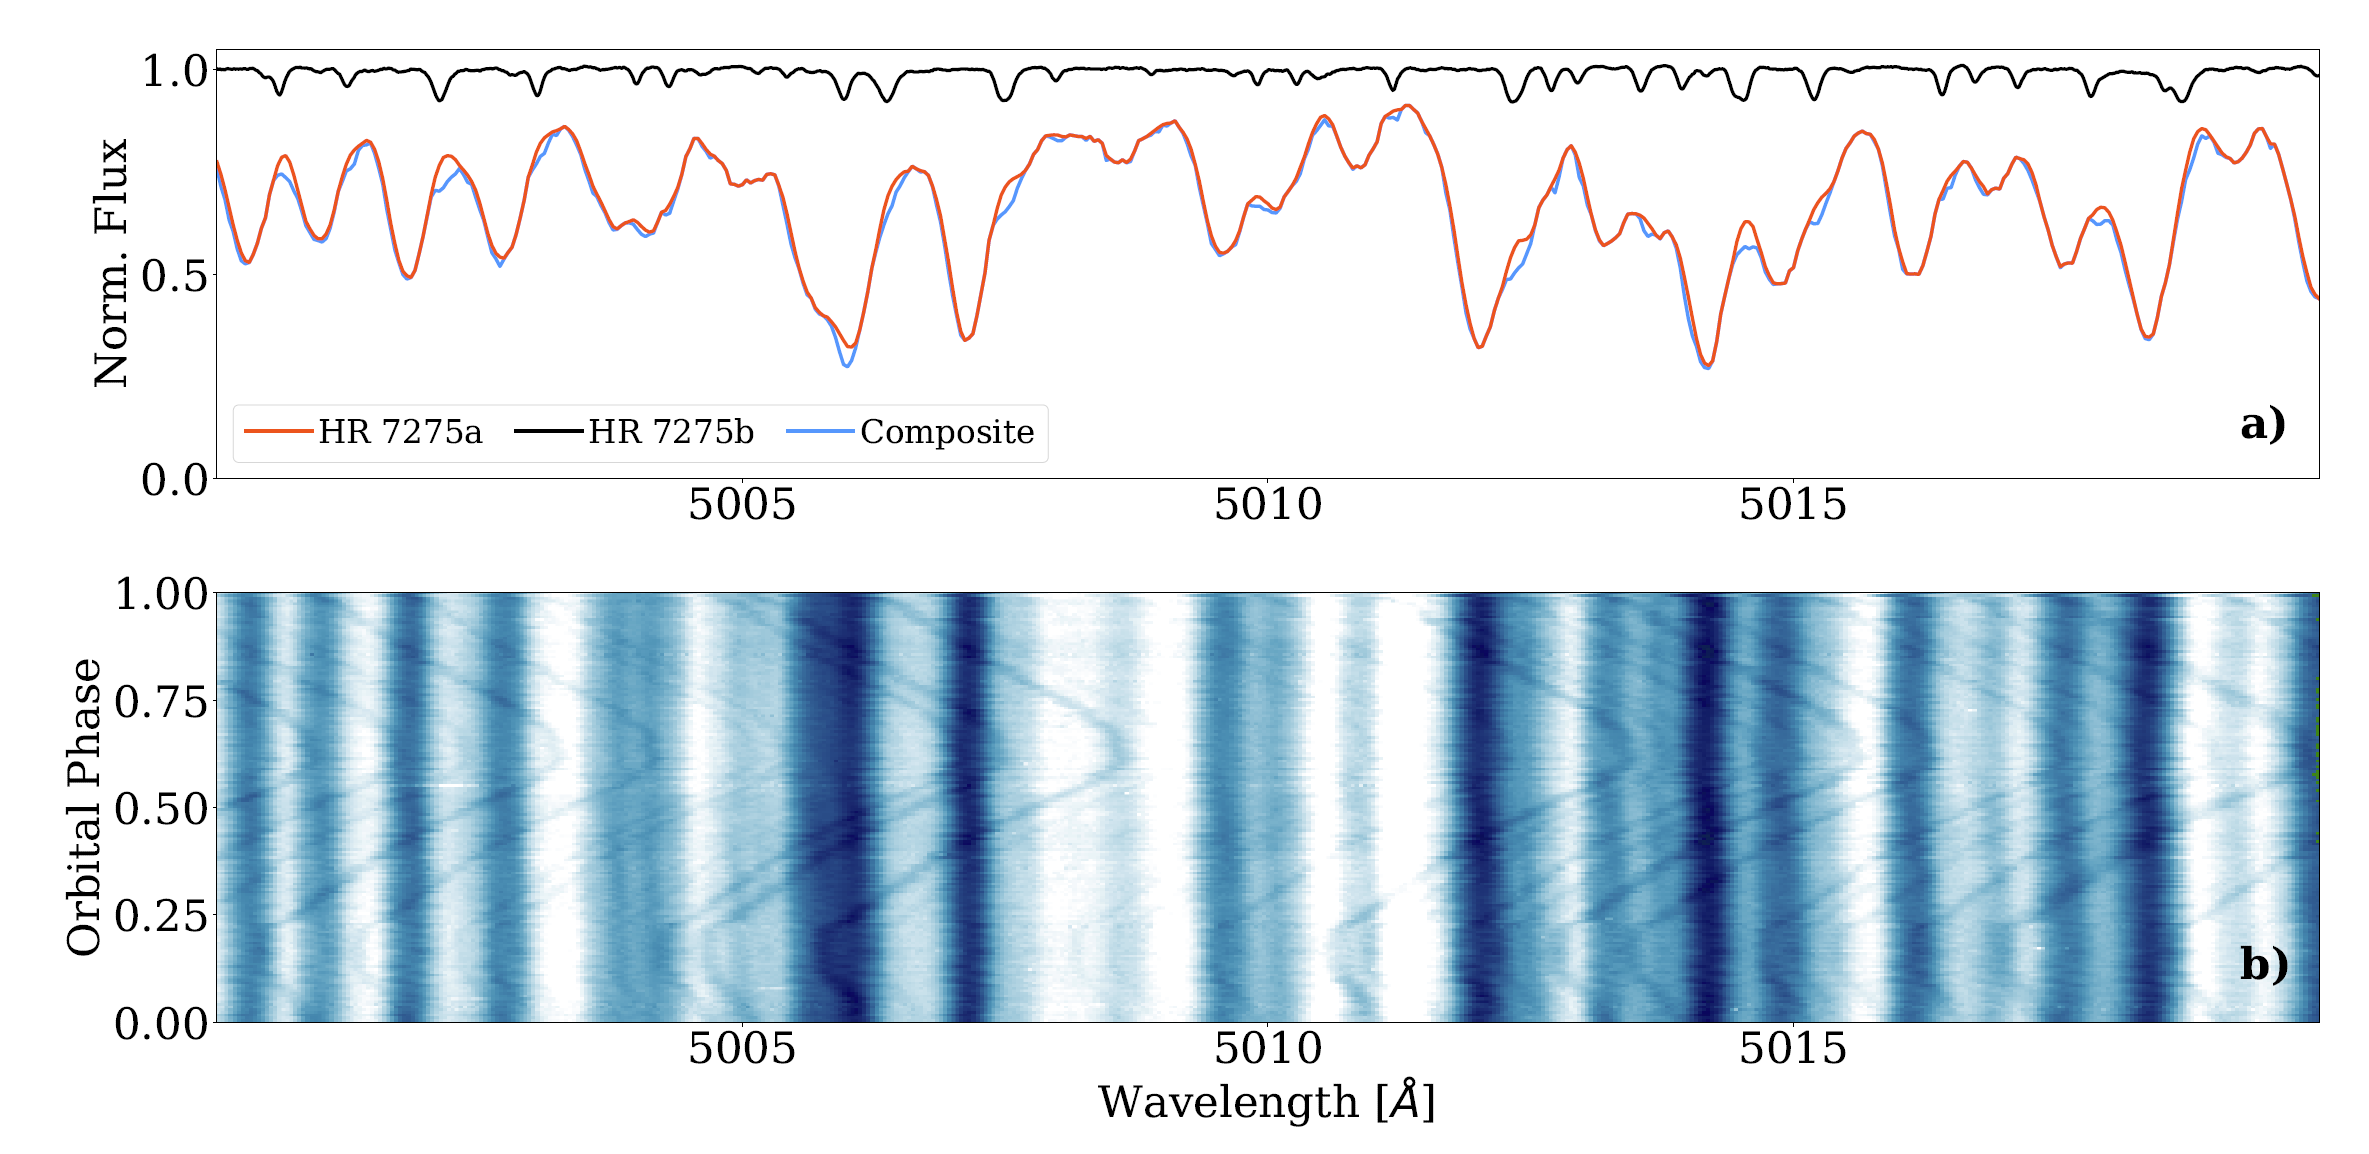
Time-series of the radial velocity obtained from the Na D2 (blue) and Na D1 (red) lines observed during solar eclipse. The vertical lines indicate the time of maximum obscuration. The line-core velocities (top-left) are computed from a parabola fit to the line core, whereas the line-wing velocities reflect bisector velocities at certain distances from the line core, which are given in milli-Ångstrom in the lower-right corner of each panel. The relative formation heights are given in the corresponding color in the lower-left corner of each panel.

Read more: Dineva et al., 2024, Sol. Phys. 299, 123

Retrieving Young Cloudy L Dwarfs: A Nearby Planetary-mass Companion BD+60 1417B and its Isolated Red Twin W0047

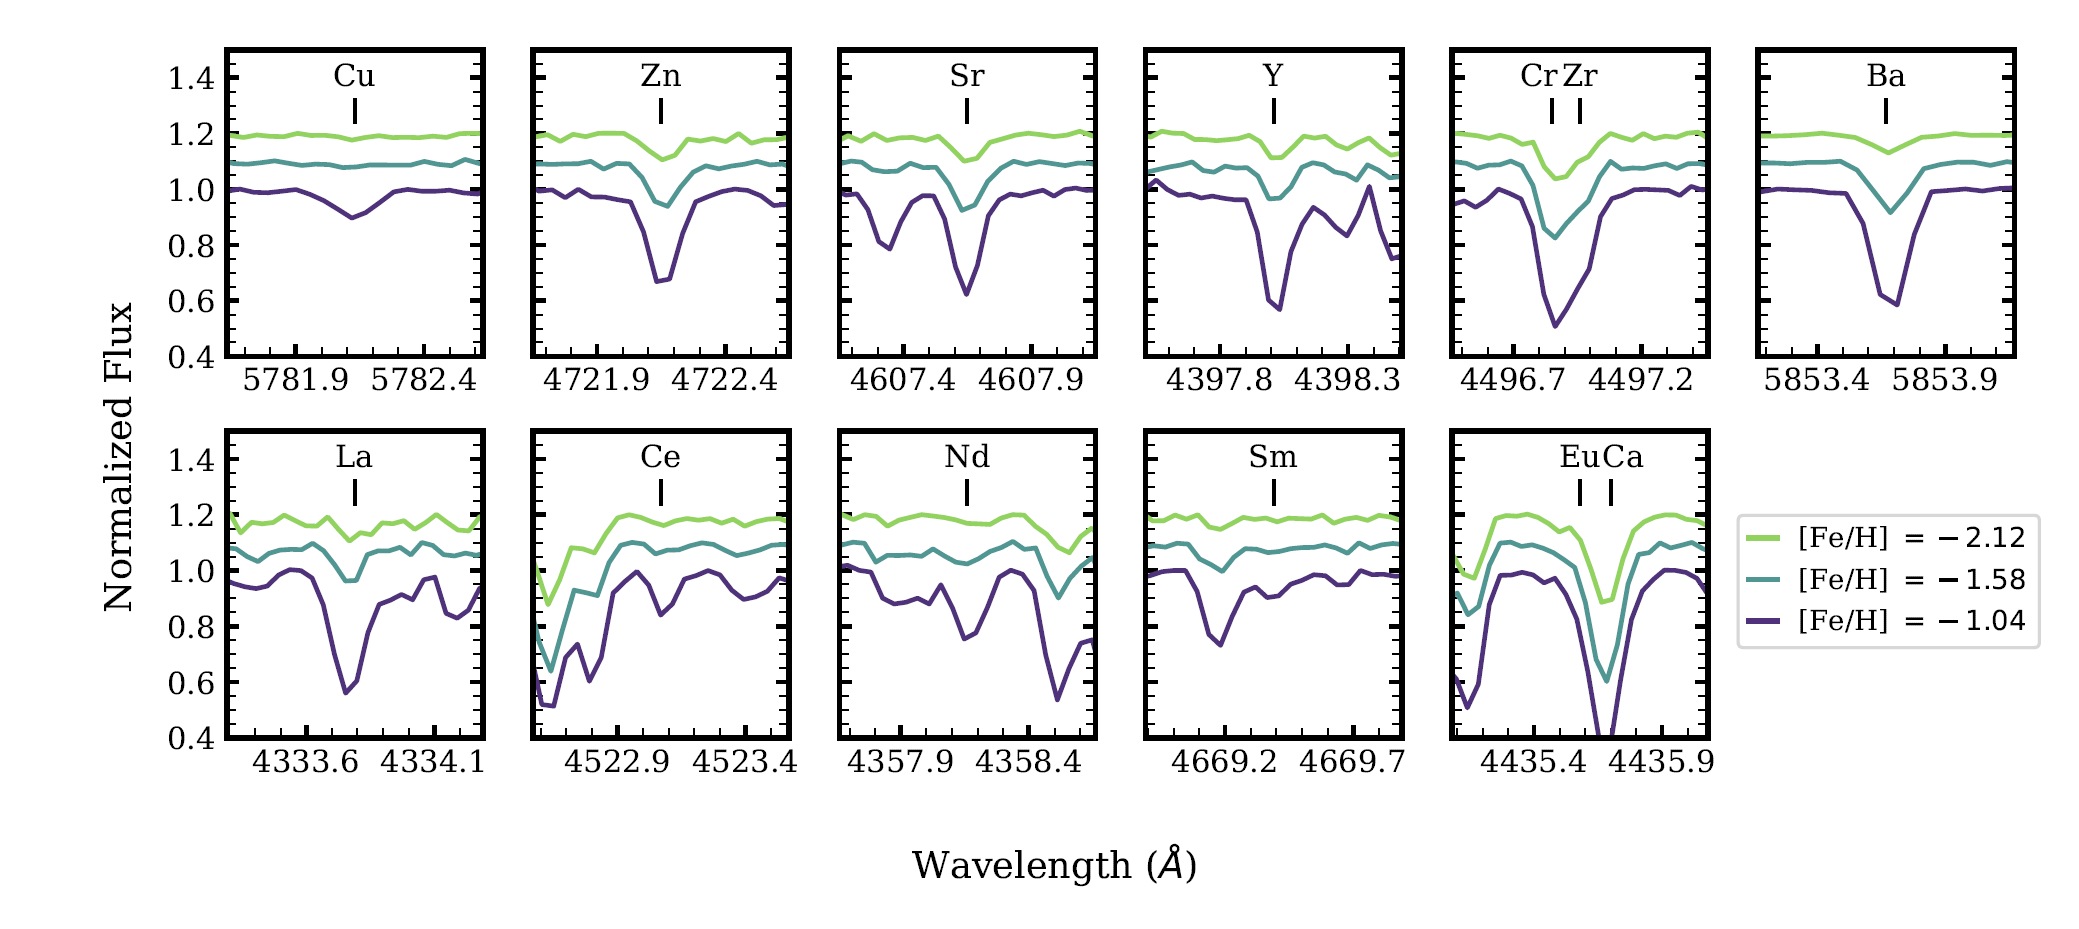
We present an atmospheric retrieval analysis on a set of young, cloudy, red L dwarfs—CWISER J124332.12+600126.2 (BD+60 1417B) and WISEP J004701.06+680352.1 (W0047)—using the Brewster retrieval framework. We also present the first elemental abundance measurements of the young K-dwarf (K0) host star, BD+60 1417, using high-resolution (R = 50,000) spectra taken with the Potsdam Echelle Polarimetric and Spectroscopic Instrument on the Large Binocular Telescope. In the complex cloudy L-dwarf regime the emergence of condensate cloud species complicates retrieval analysis when only near-infrared data are available. We find that for both L dwarfs in this work, despite testing three different thermal profile parameterizations we are unable to constrain reliable abundance measurements and thus the carbon-to-oxygen ratio. While we cannot conclude what the abundances are, we can conclude that the data strongly favor a cloud model over a cloudless model. We note that the difficulty in retrieval constraints persists regardless of the signal-to-noise ratio of the data examined (S/N ∼ 10 for CWISER BD+60 1417B and 40 for WISEP W0047). The results presented in this work provide valuable lessons about retrieving young, low-surface-gravity cloudy L dwarfs. This work provides continued evidence of missing information in models and the crucial need for JWST to guide and inform retrieval analysis in this regime.

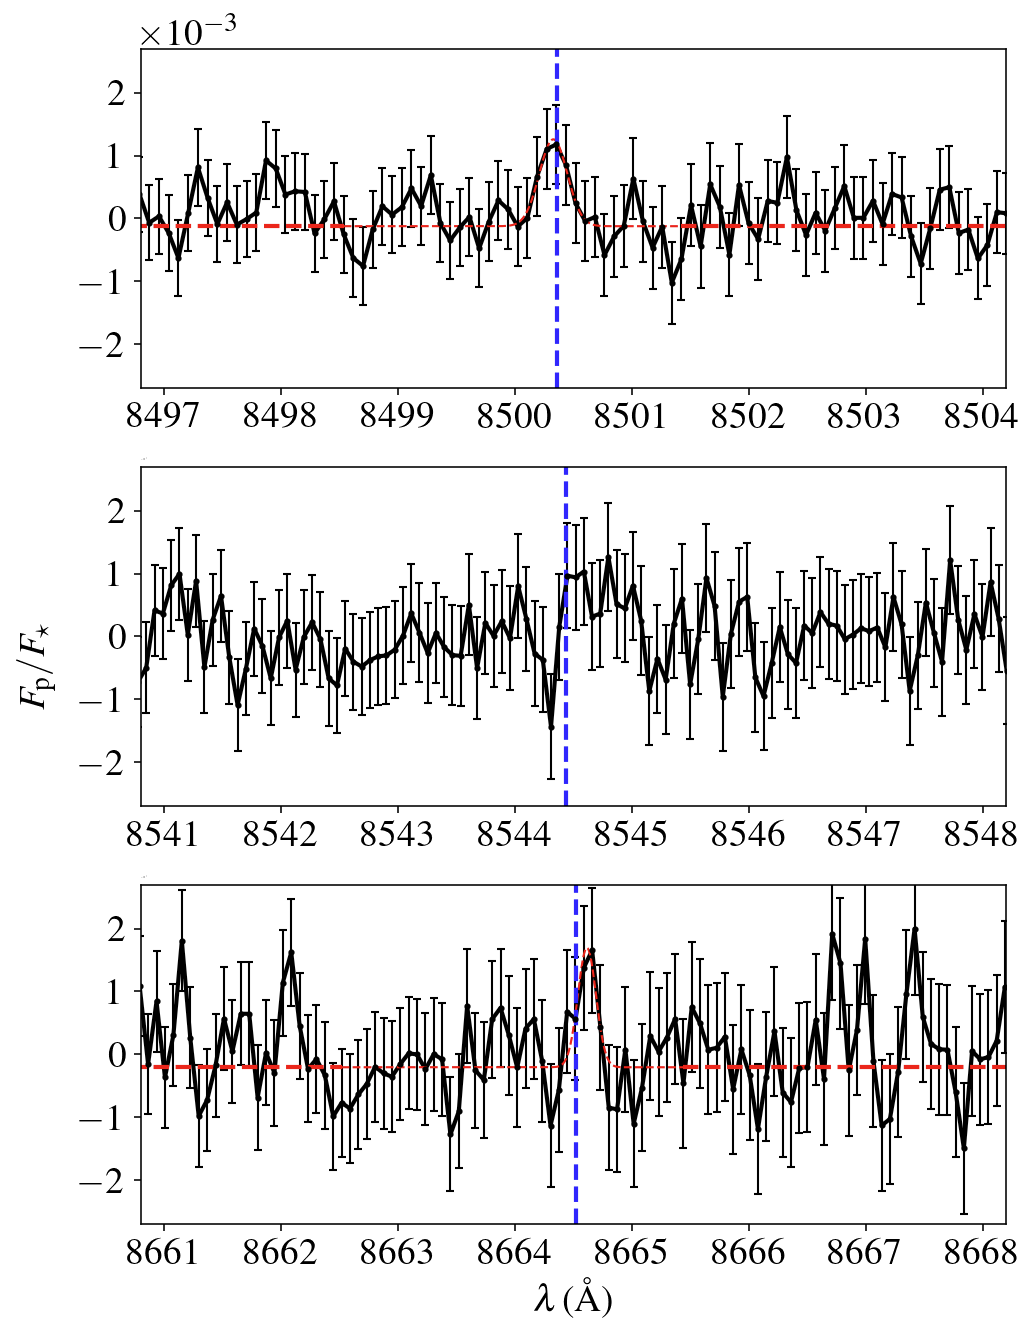
PEPSI spectra of BD+60 1417 in selected wavelength regions of 7687–7695 Å (left), 7770–7778 Å (center), and 8770–8777 Å (right). Line features used in the abundance analysis have been labeled.

Read more:  Phillips et al. 2024, ApJ, 972, 172

Solar disk integration polarimeter: An automateddisk-integration full-Stokes-vector solar feed for thePEPSI spectrograph

We introduce a new solar feed for the PEPSI nighttime spectrograph of the LBT. It enables spectroscopy of the Sun-as-a-star in circular polarization (CP) and linear polarization (LP) with a spectral resolution of 250,000 (≈0.025 Å or 600 m s−1) for the wavelength range 383–907 nm. The polarimeter is a dual-beam design with a modified Wollaston prism as beam splitter and linear polarizer combined with a retractable super-achromatic 𝜆∕4 retarder. The Wollaston beam diameter is 14 mm and large enough that it does not require a classical telescopic feed anymore. Both polarimetric beams are re-imaged into respective integration spheres from which two fibers feed the scrambled light to the spectrograph. The system is fully automated in the sense that it finds the Sun in the morning, closes the guider loop, observes a predefined number of individual spectra, and moves to a home position at the end of the day. Among the scientific aims is Zeeman–Doppler imaging of the Sun as a star over the next activity cycle. Our first-light application detects a clear Stokes-V/I profile with a full amplitude of 1 × 10⁻⁴ on, for example, October 13, 2023, suggesting a solar disk-averaged line-of-sight net magnetic field of +0.37±0.02 G. Comparison of this value with a contemporary full-disk line-of-sight magnetogram suggests an unsigned mean field of about ≈13 G.

Full facility close up. (a) CAD sketch. Shown are the polarimeter unit, its PlaneWave alt-az mount, the pier, and the Baader AllSky dome. The light-entrance baffle sticks out of the main polarimeter box and points in the south direction. (b) As built. In this picture the telescope points in the east direction shortly after sunrise. Notice the small circular opening in the box to the top right of the baffle, which is the guider telescope.

Read more: Strassmeier et al. 2024, AN, 345, e240033

Exploring the directly imaged HD 1160 system through spectroscopic characterization and high-cadence variability monitoring

The time variability and spectra of directly imaged companions provide insight into their physical properties and atmospheric dynamics. We find an effective temperature Teff = 2794+115−133 K on the first night, consistent with the literature, but a cooler Teff = 2279+79−157 K on the next. We estimate the mass of HD 1160 B to be 16-81 MJup, depending on its age. We also present R = 50 000 high-resolution optical spectroscopy of host star HD 1160 A obtained simultaneously with the PEPSI spectrograph. We reclassify its spectral type to A1 IV-V and measure its projected rotational velocity vsini = 96+6−4 km s-1. We thus highlight that gvAPP-enabled differential spectrophotometry can achieve repeatable few per cent level precision and does not yet reach a systematic noise floor, suggesting greater precision is achievable with additional data or advanced detrending techniques.

The left panel shows the PEPSI spectrum of the host star HD 1160 A in blue, overplotted with the best-fitting model from BT-Nextgen in orange. The fitting process was carried out for the region of the spectrum covering 392–429 nm. The contour plot in the right panel shows the χ2 distribution for several temperatures and vsini at fixed log(g) of 3.5.

Read more: Sutlieff et al. 2024, MNRAS, 531, 2168

The PEPSI Exoplanet Transit Survey (PETS) – V. New Na D transmission spectra indicate a quieter atmosphere on HD 189733b

Absorption lines from exoplanet atmospheres observed in transmission allow us to study atmospheric characteristics such as winds. We present a new high-resolution transit time-series of HD 189733b, acquired with the PEPSI instrument at the LBT and analyse the transmission spectrum around the Na D lines. We model the spectral signature of the RM-CLV-effect using synthetic PHOENIX spectra based on spherical LTE atmospheric models. We find an Na D absorption signature between the second and third contact but not during the ingress and egress phases, which casts doubt on the planetary origin of the signal. Presupposing a planetary origin of the signal, the results suggest a weak day-to-nightside streaming wind in the order of 0.7 km/s and a moderate super-rotational streaming wind in the order of 3-4 km/s, challenging claims of prevailing strong winds on HD 189733b.

The HD 189733b transit observation. Top: Continuum signal-to-noise ratio per combined pixel (95 per cent quantile). Bottom: The RM effect. Dashed vertical lines show the contact points 1st–4th (cyan) and 2nd–3rd (purple).

Read more: Keles et al. 2024, MNRAS, 530, 4826

Testing pulsation diagnostics in the rapidly oscillating magnetic Ap star gamma Equ

Pulsations of rapidly oscillating Ap stars and their interaction with the stellar magnetic field have not been studied in the near-infrared (near-IR) region despite the benefits these observations offer compared to visual wavelengths. The main advantage of the near-IR is the quadratic dependence of the Zeeman effect on the wavelength, as opposed to the linear dependence of the Doppler effect.

To test pulsation diagnostics of roAp stars in the near-IR, we investigated the pulsation behaviour of one of the brightest magnetic roAp stars, γ Equ, which possesses a strong surface magnetic field of the order of several kilogauss and exhibits magnetically split spectral lines in its spectra.

The profile shapes of both studied magnetically split spectral lines in H-band vary in a rather complex manner probably due to a significant decrease in the strength of the longitudinal field component and an increase in the strength of the transverse field components over the last decade. A mean magnetic field modulus of 3.9 kG was determined for the Zeeman triplet Fe I at 1563.63 nm, whereas for the pseudo- doublet Ce III at 1629.2 nm we observe a much lower value of only about 2.9 kG. For comparison, a mean field modulus of 3.4 kG was determined using the Zeeman doublet Fe II at 6249.25 Å in optical PEPSI spectra recorded just about two weeks before the 2022 CRIRES+ observations. Different effects may lead to the differences in the field modulus values. The measurements of the mean magnetic field modulus in different pulsational phase bins suggest a field modulus variability of 32 G for the Zeeman triplet Fe I and 102 G for the pseudo-doublet Ce III.

Zeeman doublet Fe II at 6149.25 Å used for measuring the mean magnetic field modulus in observations obtained in different years using different instruments. Right: Comparison of the shape of line profiles of Zeeman triplet Fe I 1563.63 nm from different years in near-IR region.

Read more: Järvinen et al. 2024, A&A 683, A66