1. Executive summary
We are carrying out a high-resolution spectroscopic survey of TESS target stars around the northern ecliptic pole (NEP). The NEP field comprises of approximately 800 square degrees with 311 main-sequence stars brighter than V=8.5mag and cooler than F0. Our aim is the characterization of these stars already prior to TESS data release. Two R=200,000 spectra would be obtained for each of these stars at different epochs. The first visit shall cover the wavelengths 480-544nm and 628-741nm, the second visit shall re-use the 480-544nm region but extend in the red to 741-912nm. Predicted S/N ratios for the limiting magnitude of 8.5mag in V for a single spectrum for a 90-min exposure are 100:1 in the red and 50:1 in the blue. Typical S/N ratios would be more like 150 in the red and 120 in the blue. The survey requires 50 nights each year around culmination of the NEP (May-July) for 3 years.
2. Science goals and deliverables
The basic idea is to provide precise spectroscopic parameters for potential planet-host candidates for TESS.
2.1 Data product
Practical reasons limit us to stars brighter than 8.5mag in V and to the use of a single spectrograph set-up, i.e., the use of just two cross dispersers (CD). An example of a single spectrum in the set-up with CD III and V is shown in Fig. 1. This results in a wavelength coverage of 480-544nm and 628-741nm, respectively. We plan 1.5-hour integrations on maximum.
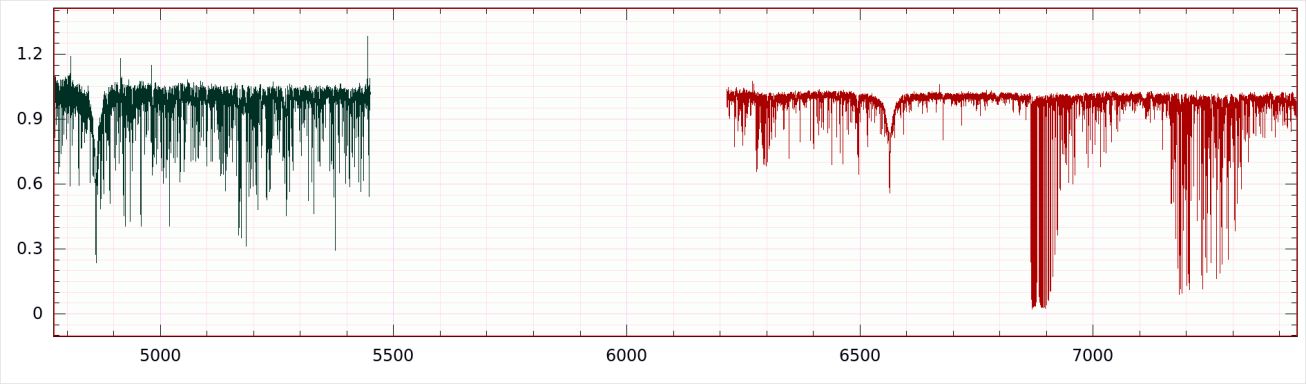
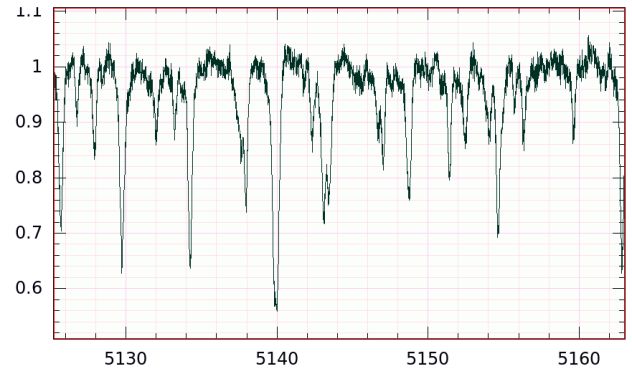
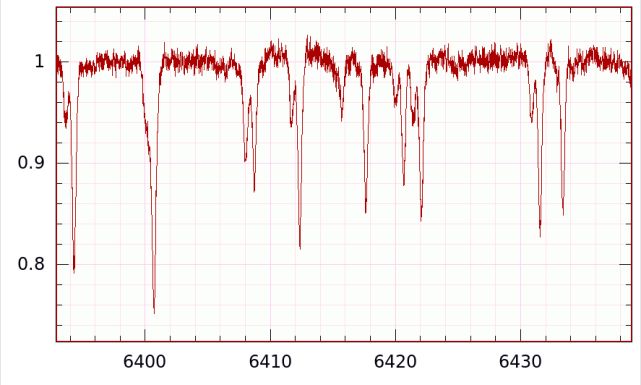
Fig. 1 – Example of a single VATT-PEPSI spectrum with CD-III and CD-V. Top: Full coverage with CD III (left part of the spectrum ) and CD V (right part, color coded). Bottom: Two zooms into sub-regions of ≈40A. S/N ratio is 70:1 in CD III and 155:1 in CD V, which is the expected S/N.
Integration times will vary with brightness. Our experience with the current image-slicer setup and its direct coupling is based on observations of flux standards as well as HR5110 during the early March 2017 run. Integrations on HR5110 (F2/K2, B=5.38,V=5.00, exp=60min) and IN Comae (G5III, B=9.72, V=8.88, exp=90min) gave S/N ratios of 470/250 and 100/45, respectively, each for CD V/III. From these values we conclude to adopt integration times of 60min for stars brighter than 7.5mag, 75min for 7.5-8.0 mag, and 90min for stars fainter than this. The expected S/N for the brightness range 7.5-8.5mag is then comparable and should be approximately 150:1 in CDV and 80:1 in CDIII. The final product would be with co-added CD-III spectra.
The survey deliverables are
- Radial velocity: A single radial velocity per spectrum good to 2-3 m/s.
- Global stellar parameters: effective temperature, gravity, metallicity, microturbulence, vsini, mass & age from a comparison with tracks and isochrones and a Gaia parallax.
- Chemical abundances of as many elements as possible. Most importantly α elements and CNO.
- An average line bisector and differential wavelength shift as a measure for convective blueshift.
- Activity: Hα & Hβ and CaII IRT line-core fluxes.
2.2 Radial velocity
The standard PEPSI wavelength calibration with a Th-Ar lamp is precise to ≈10-30 m/s depending on wavelength and target. Any higher precision for longer periods in time is only achievable with a simultaneous exposure of the fringes from the Fabry-Perot etalon calibrator. This is the recommended RV mode for PEPSI observations.
2.3 Global stellar parameters
Model atmospheres and synthetic spectra from MARCS (Gustafsson et al. 2008, ASP Conf. Ser., 378, 60) are ready to be used. Synthetic spectra exist and are pre-tabulated with metallicities between -2.5dex and +0.5dex in steps of 0.5dex, logarithmic gravities between 1.5 and 5 in steps of 0.5, and temperatures between 3500K and 7250K in steps of 250K for a wavelength range of 380–920nm (all based on a micro turbulence of 2 km/s). This grid is then used to compare with selected wavelength regions of the two stars. The comparison is done with program ParSES. ParSES is based on the synthetic spectrum fitting procedure from Allende-Prieto et al. and described in detail in Allende-Prieto (2004, AN, 325, 604) and Jovanovic et al. (2013, Publ. Astron. Obs. Belgrade, 92, 169).
Among the deliverables are fits to the position in the HR-diagram. We base these on Gaia parallaxes and our spectroscopic effective temperature and metallicities. Tracks and isochrones will be taken from/computed with the new YaPSI – The Yale-Potsdam Stellar Isochrones grid (Spada et al. 2017, ApJ 838, 161).
2.4 Chemical abundances
Here we have several choices. 1) Measuring equivalent widths of individual lines using MOOG (Sneden, C. 1973, ApJ, 184, 839) or, 2) apply synthetic fits to selected wavelength regions (also using MOOG or turbospectrum). Recent studies have hinted at some chemical preference for terrestrial planets. In particular, Adibekyan et al. (2012, A&A, 547, A36 and 2015, A&A, 581, L2) showed that metal-poor planet hosts tend to have a higher [Mg/Si] ratio when compared to metal-poor stars without detected planets. Getting the Mg I triplet around 5170Å (within CD-III) is thus important. In addition, Dressing et al. (2015) found that, for a small sample of Kepler planets with well-known masses and radii, those planets with masses <6MJ are likely to have very similar iron to magnesium silicate ratios, and therefore follow a single mass-radius relationship. If so, then one could potentially use the photospheric abundances of a host star with terrestrial planets to constrain the possible iron to magnesium silicate ratios of the planets, and then given the radii, estimate the masses, or given the masses (or a lower limit) determine radii (or places limits on them).
Besides the α-elements (Mg, Si but also Ca, Ti), CNO abundances are of highest priority. It requires the C2 Swan line system at λ5086 and 5135Å to be in the observable spectral range, which are all within CD-III. Three high-excitation CI lines are usually also measured: λ5052.17, 5380.34 and 7113.18Å (the first two within CD-III, the latter within CD-V). High-excitation N lines are at λ7468.3, 8216.3, and 8683.4Å (all of them within CD-VI). Oxygen is available through the forbidden lines at 6300 and 6363Å, the permitted line at 6158Å, and the triplet at 7774Å (the former within CD-V and the latter within CD-VI). We will miss the 6158-Å line which is within the CD-IV wavelength coverage. This line is usually very weak though and less important. For all these lnes there are 3D NLTE corrections available (Amarsi et al. 2016, MNRAS 455, 3735).
2.5 Convective blueshift
Observations of line bisectors have shown the presence of asymmetries which result from the effect of stellar granulation (cf. Dravins … Gray a.o.). By studying the asymmetries in different types of stars, and for lines of different excitation potential and ionization stages (i.e. formed at different levels in the atmosphere) it is possible to quantify convection in stars. Very high resolution (R>200,000) is required to sample adequately the line profile of cool stars. One of the most challenging tasks today for our understanding (and correction) of Doppler shifts from convective patterns is the effect of suppressed convective blueshift in active regions (Dravins et al. 1981, A&A, 96, 345). It adds to the RV “noise” of a star and, together with magnetic activity in form of starspots, limits or even prevents the detections of low-mass planets. One possible deliverable is the bisector span, e.g., for weak and strong lines but also the relative wavelength shift of lines or line pairs affected by convection.
2.6 Activity indicators
We would measure the absolute line-core flux in Balmer Hα (6563Å, in CD-V), Hβ (4861Å, in CD-III), and the Ca II infrared triplet (8498, 8542 and 8662 Å in CD VI).
3. Target lists
3.1 Visibility Northern Ecliptic Pole (NEP)
The central coordinates of the NEP are: 18h 0m 0.0s, declination +66°33′ 38.55″ for 2000.0. Its visibility at MGIO is thus optimal for the period June 1 through July 10. The overall visibility (staralt plot) is shown in Fig. 2. High-declination targets would be observed in the evening and the morning while low-declination stars must be scheduled for observation during time of meridian passage.
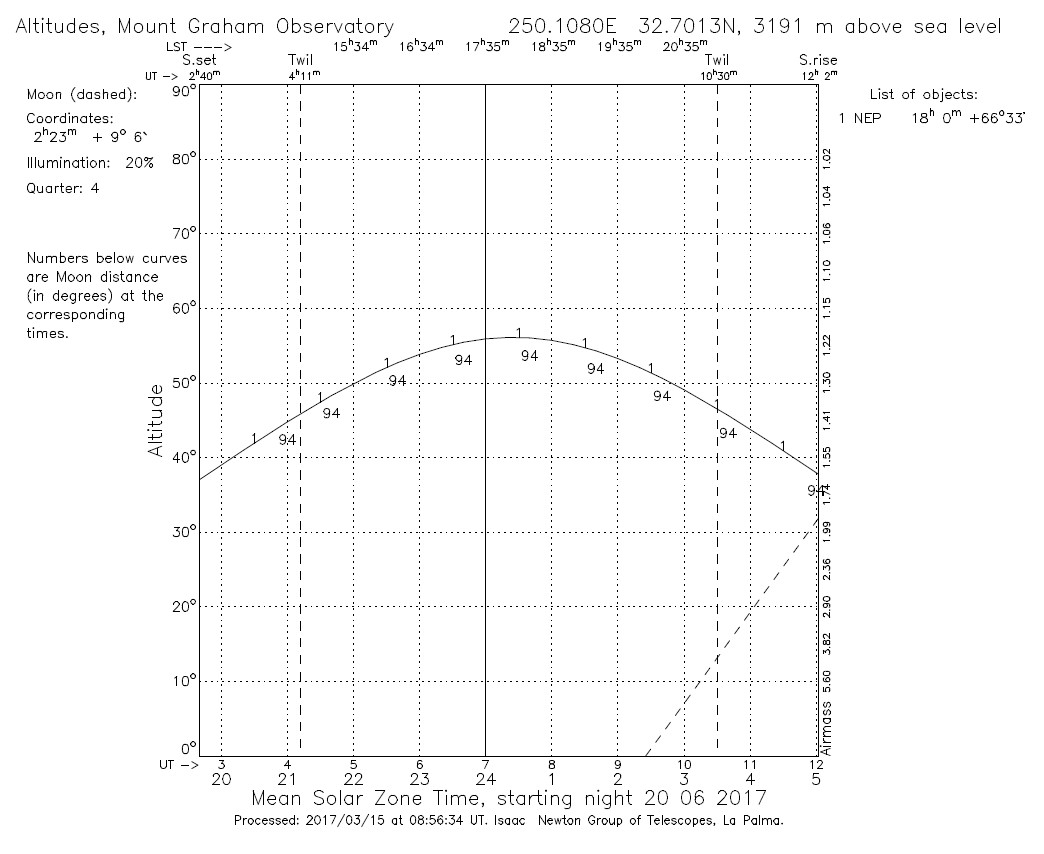
Fig. 2 – Visibility of the NEP at MGIO for June 20. Note that the declinations of individual targets range from +51° to +78°.
3.2 Full list V<8.5mag, cooler than F0
Table 1 is an excerpt of the full target list of 1091 stars cooler than F0. The following tables are available in electronic version (file name is given first).
north_ecl_full: 1440 stars (16 deg from N ecliptic pole, V<= 8.5) f2.ascii: stars with B-V>=0.3: 1091 entries dwarfs_f2: stars with B-V>=0.3, known parallax and close to MS: 311 entries giants: stars with B-V>=0.3, known parallax and not dwarfs: 536 entries
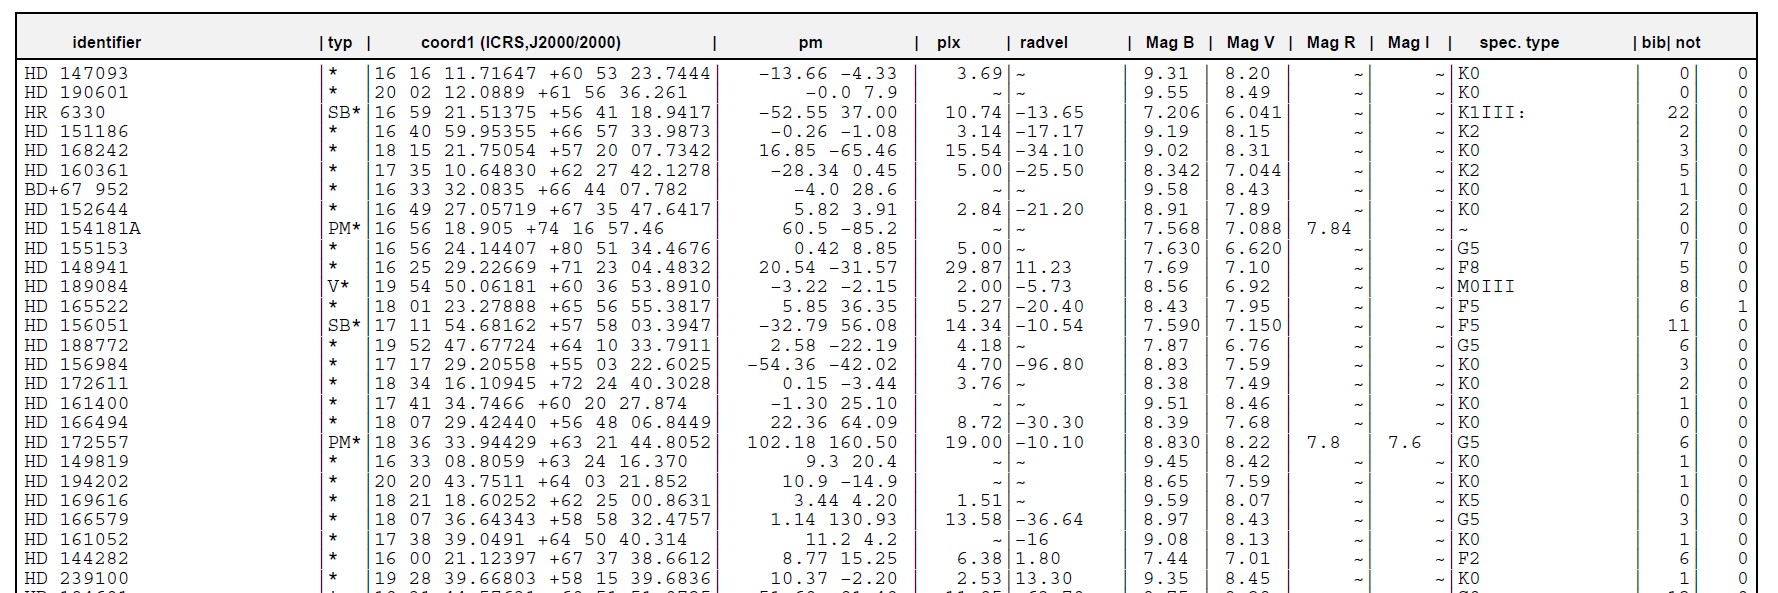
Fig. 3 shows the H-R diagram of the full target list in a circular field with radius 16deg around the NEP.
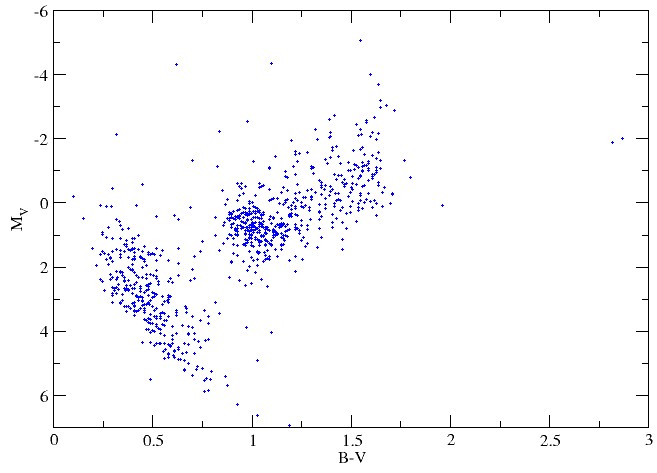
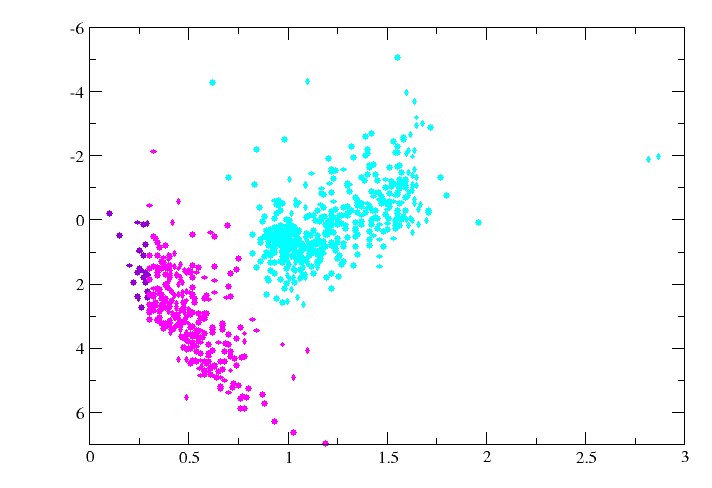
Fig. 3 – Left: HRD of the target stars of the full list. Right: The 311 dwarf targets of the survey are the magenta points.
3.3 Dwarfs vs. giants
There are 311 dwarfs in the selected NEP field brighter than 8.5 in V and redder than B-V = +0.3 (F0). These are the priority targets of this survey. The sample still includes some evolved stars (cf. Table 1) as can be judged from their parallax and apparent magnitude but the number is low. There are 536 known giants in the same field with the same constraints.
3.4 Options: extended wavelength coverage
Trade off: We decided to visit the 311 targets a second time, but then with another CD combination. There are three options to do this:
- CD-II (426-480) and CD-IV (544-628),
- CD-II (426-480) and CD-VI (742-910),
- CD-III (480-544) and CD-VI (742-910).
In any case, it gives a second independent RV for another epoch which is helpful for binarity indication. The extended wavelength coverage would also approximately double the number of spectral lines that can be used to determine chemical abundances; with CD-IV, in particular, we would have access to the sodium D lines and with CD-VI to the Ca infrared triplet and potassium (lithium is included in CD-V). CD-II is too inefficient in combination with the 450m fiber link for stars fainter than 8th mag (but the dichroid does not allow using CD-III when the adjacent CD-IV disperser is in the red beam, so there is no other choice). Reinserting CD-III for the second visit has the appeal of increasing the S/N if needed and keeping the possibility for a direct comparison of certain line profiles, e.g., Hβ but also the Mg I triplet around 5170Å. Of course, another option is to include a third visit for a subset of targets and then get full wavelength coverage from 426-912nm (still excluding CD-I, 383-426nm).
As of the previous version of the document, we favor option 3), that is the use of CD-VI and the re-use of CD-III. The final wavelength coverage from two visits would then look like the one shown in Fig. 4.
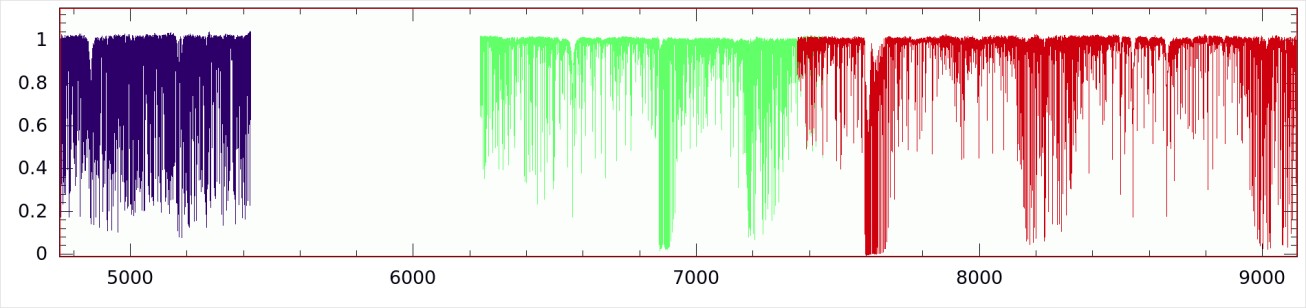
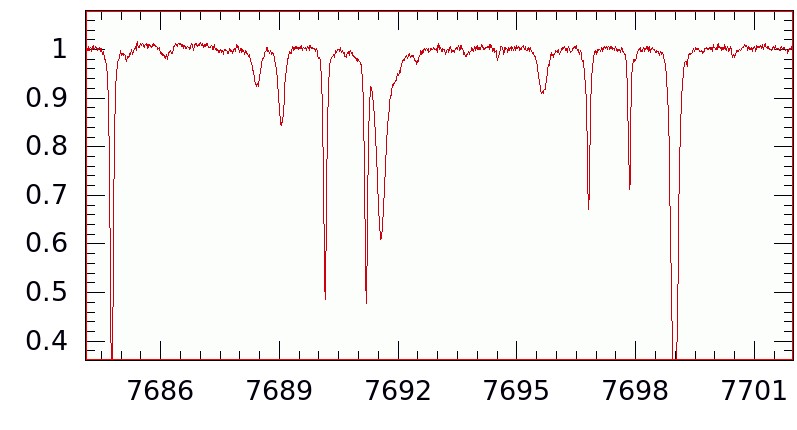
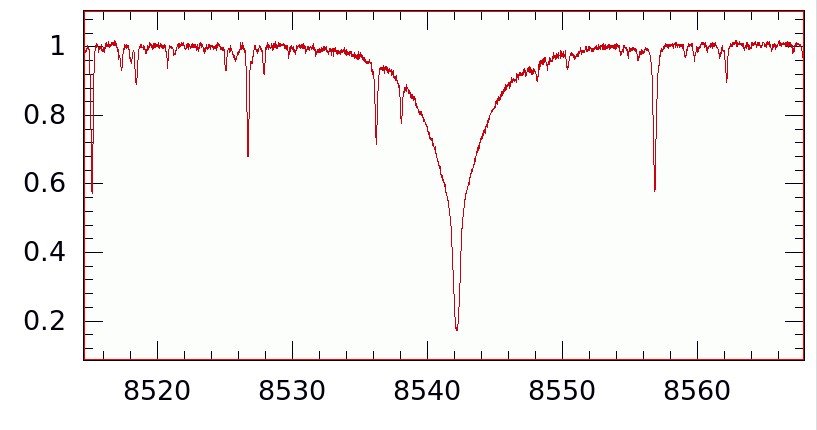
Fig. 4 – Example spectrum for the extended wavelength coverage. Top: Full range with CD-III, CD-V and CD-VI (color coded). Bottom: Two zooms into sub-regions from CD VI. S/N ratio is 250:1 in CD-VI (we will not reach that high though).
3.5 Status and conclusions from pilot survey
A 10-night test survey was conducted May 18-27, 2017. The 130L mode was employed (R=200,000). Nine nights were clear and usable. Ilya Ilyin was observing on site. Michael Franz was TO. 27 target stars were observed: 22 of these in CD III+V and CD III+VI, 5 of them only in CD III+V. S/N was as expected. So, in 10 clear (summer) nights one could do 27 targets with two visits per target, or 135 targets per year (at most). To reach a minimum of 311 targets, therefore, the weather loss must be less than 23% (or 35 nights in 3 years), which is feasible for June-July. We conclude that the survey is doable in 3 years.
4. Survey operation
4.1 Time needed
The weighted average integration time per target is around 80min plus 5min overhead. With an optimistic 8-hr night, the 311 dwarf targets would require ≈60 nights. Given a 40% weather loss, this translates to a total of 84 scheduled nights for the first visit. To get the extended wavelength coverage, this number is to be doubled, i.e., ≈170 nights. It then translates to a 4-year survey with 40 nights for every NEP-visibility season. One could shorten this to 3 years if an extra 10 nights is being added annually to the 40 core nights during NEP culmination. The option of using the VATT 10 more nights into the monsoon summer-shutdown in mid-July is to be explored as well. Another way to shorten the survey is to re-observe only a subset of the targets for the second visit, e.g., just the G dwarfs or F8-G8 or lesser targets but all wavelengths. The default in this document is two visits for all targets during 50 nights per year.
According to D. Latham (CfA; TESS ground-based support coordinator) “TESS is scheduled to observe the southern ecliptic hemisphere first. The official launch date is 20 December 2017, but I will be (pleasantly) surprised if the actual launch is accomplished before June 2018 [June 2018 is the current official launch date!]. The south ecliptic hemisphere will provide targets with declinations south of +17 degrees during the northern winter. The targets observed during the winter of 2018/2019 will finally be available for observing from Arizona in the winter of 2019/2020. Lots of targets in the northern ecliptic hemispheres will finally start flowing in the fall of 2020.”
Therefore, it would be highly desirable to finish the survey before fall 2020, i.e., in three rather than four years, in order to have the deliverables ready for the literature by early 2021. This would guarantee citation of our results by even the first batch of TESS discovery papers.
4.2 Principal telescope operation
A second telescope operator (TO) is needed for the continuous 50 night runs in order to relief Michael Franz. We propose that one of us (Daniel Sablowski) is trained by M. Franz to operate the telescope in his absence. The two would alternate in 10-night shifts. Michael starts. Main difference is that D. Sablowski would also conduct the observations. We envision the following time sequence of operators and observers for the first year (2018).
| Mo 28.5.-Fr.13.7.2018 | Operator | Observer | Location of PEPSI UI |
| Night 1-10 | Michael | Ilya | AIP office Ilya |
| Night 11-20 | Daniel | Daniel | VATT |
| Night 21-30 | Michael | Silva | AIP MCC |
| Night 31-40 | Daniel | Daniel | VATT |
| Night 41-50 | Michael | Ilya | AIP office Ilya |
Notes: Michael = Michael Franz, Daniel = Daniel Sablowski, II = Ilya Ilyin, MCC is the Media and Communication Center at AIP.
The schedule for 2019 and 2020 will be determined in time. An extra TO shall be provided through a student pool in Arizona, c/o Paul Gabor. Observers shall come from the pool of project astronomers. First task on site is always to mount the PEPSI fiber injection unit FIU on the telescope followed by an alignment and throughput check done by Michael Franz in collaboration with Ilya Ilyin, Arto Järvinen or Daniel Sablowski from AIP. A FIU/PEPSI manual is available for the student TOs.
4.3 Instrument operation and data handling
All observations would be conducted remotely from Potsdam. The initial night for each run would be started in Ilya Ilyin’s office. Subsequently, the PEPSI User Interface would be ported alternatingly to a computer in the MCC or the VATT control room. Data will be stored in the standard PEPSI (SAN) data storage environment at LBTO and transferred to Potsdam on a daily basis after every night.
4.4 Data reduction and analysis
Data reduction would be performed under the lead of Ilya Ilyin with SDS4PEPSI on a larger computer in Potsdam. Final spectra are wavelength calibrated and continuum rectified and stored in FITS format. Data transfer is via ftp/internet. We envision that each survey deliverable or “science case” (c/o Sect. 2.1) has a “Program Principal investigator” (PPI). The PPI is in charge of producing the data product and writes as a first author the relevant publication. Additional data products can be added any time. For the time being, we propose the following PPIs:
- Ilya Ilyin; data reduction.
- Michael Weber; Radial velocities, global stellar parameters, YaPSI.
- N.N., Matthias Steffen; Chemical abundances.
- Thorsten Carroll; Line bisectors / convective blueshift.
- Silva Järvinen; Activity.
4.5 Expected data volume
The expected data volume is ≈2 TB.