
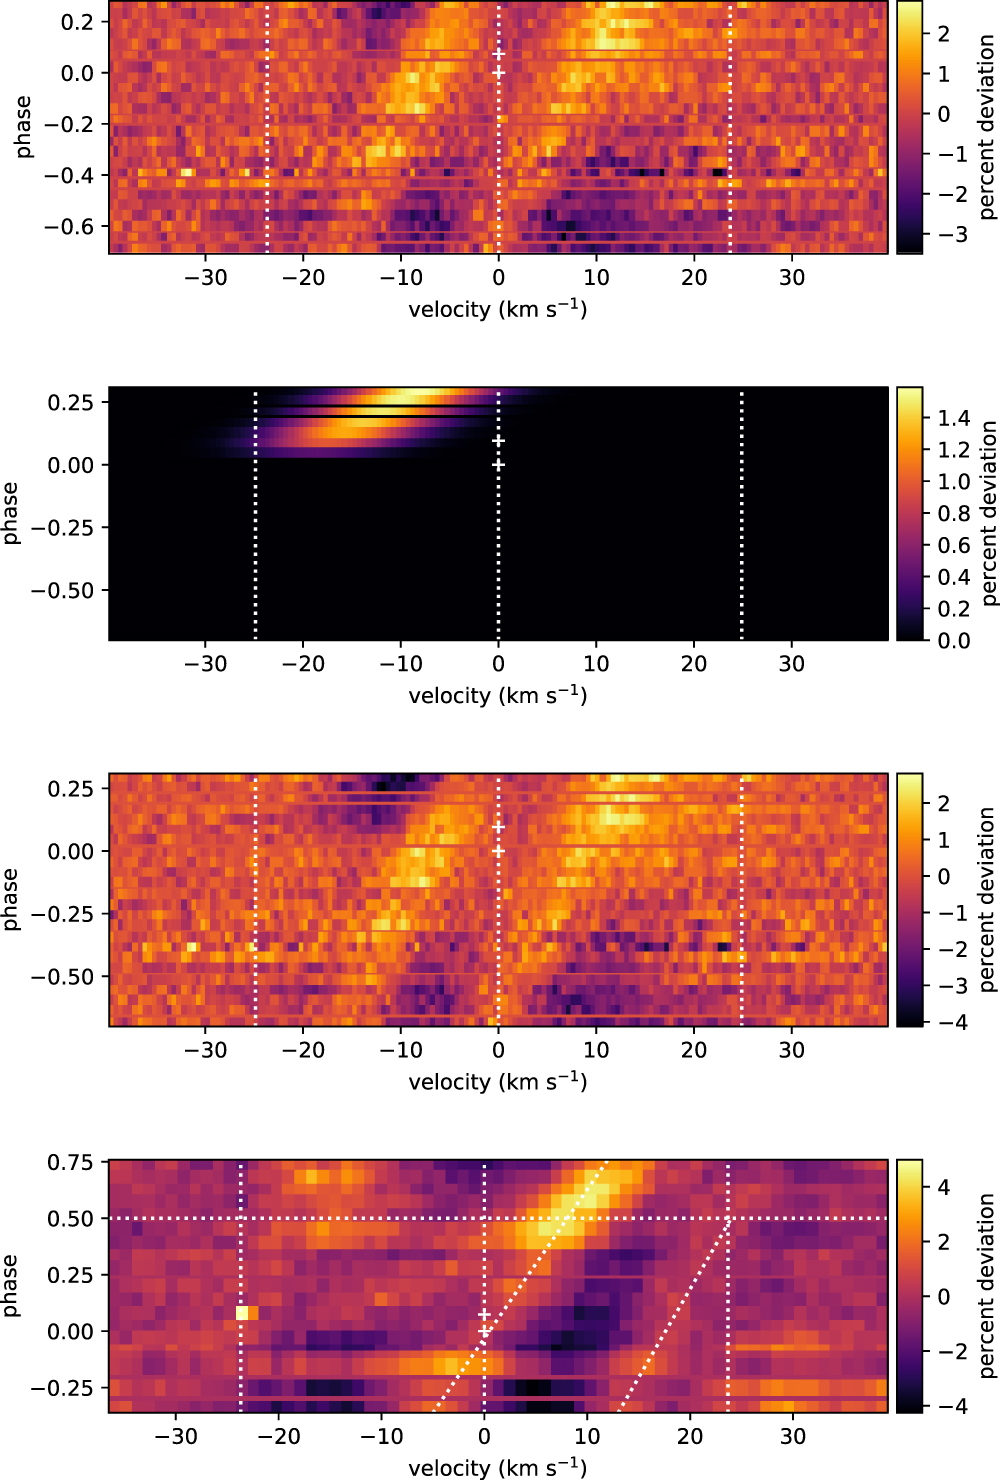
Doppler tomographic data from PEPSI (top three panels) and HIRES (bottom). All plots show the time-series line profile residuals, i.e., each horizontal line shows the deviation of the line profile from the average line profile at that time. Time increases from bottom to top; units are such that ingress = 0 and egress = 1. The vertical dotted lines show v = 0, ±$v sin i_star, the horizontal dotted line the time of mid-transit, and the two small plus signs first and second contact. In the HIRES plot we also show two slanted dotted lines to guide the eye along the spot signatures, which are less obvious than in the PEPSI data.