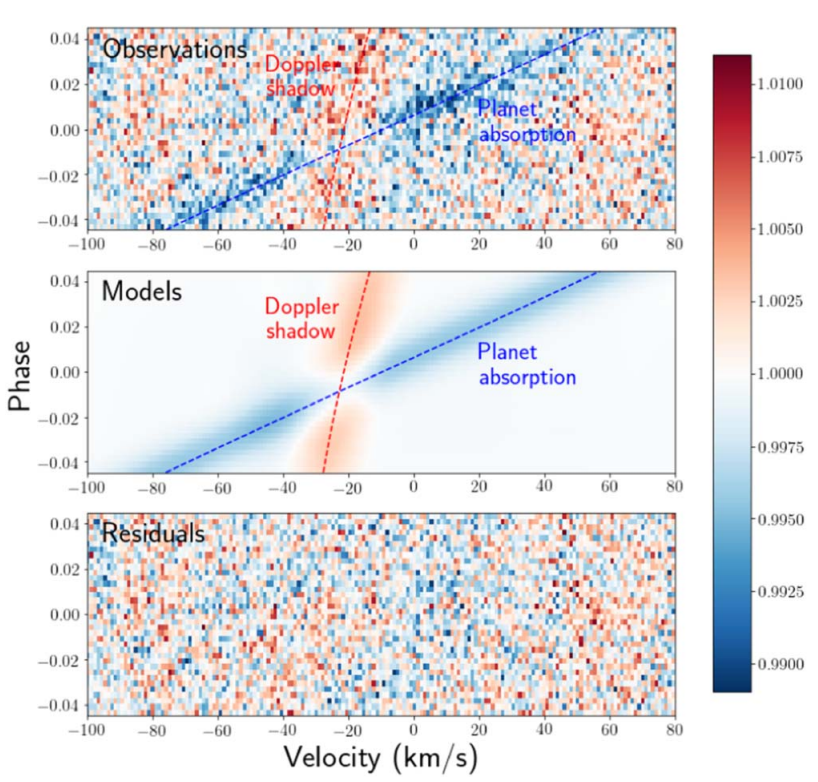
A 2D map of transmission spectra over the course of KELT-9 b’s
transit for the PEPSI 2018 data set; the blue track is formed by the planet’s
atmospheric absorption, while the red track is the Doppler shadow from the
RME. The top panel displays fully in-transit observations. The middle panel
shows the best-fit model from MCMC sampling, with the Doppler shadow and
CLV determined from numerical modeling of the planet’s transit using SME
stellar models, while the planet absorption track is a uniform Gaussian signal
shifted in velocity according to the best-fit orbital motion of the planet,
systemic velocity, and best-fit dayside-to-nightside winds. The bottom panel
shows the residuals (data–model).