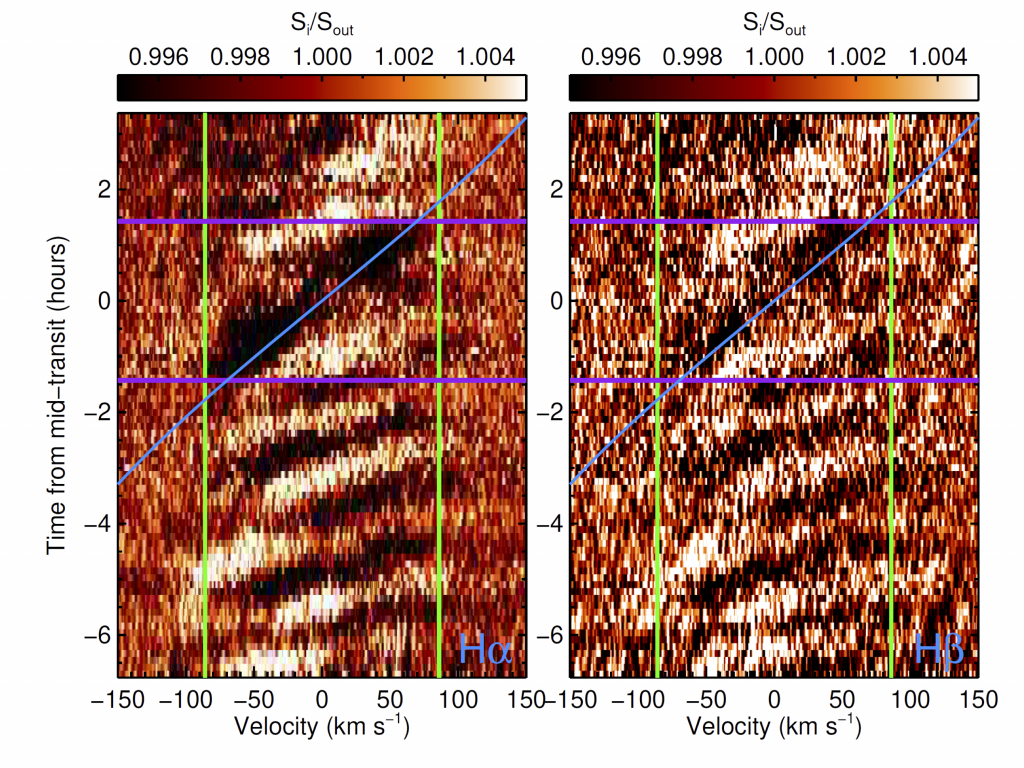
While steady empirical progress has been made in understanding the structure and composition of hot planet atmospheres, direct measurements of velocity signatures, including winds, rotation, and jets, have lagged behind. Quantifying atmospheric dynamics of hot planets is critical to a complete understanding of their atmospheres and such measurements may even illuminate other planetary properties, such as magnetic field strengths. In this manuscript, we present the first detection of the Balmer lines H-alpha and H-beta in the atmosphere of the ultra-hot Jupiter WASP-33b. Using atmospheric models which include the effects of atmospheric dynamics, we show that the shape of the average Balmer line transmission spectrum is consistent with rotational velocities in the planet’s thermosphere of vrot = 10.1 (+0.8 -1.0) km/s. We also measure a low-significance day-to-night side velocity shift of -4.6 +/-3.4 km/s in the transmission spectrum which is naturally explained by a global wind across the planet’s terminator. In a separate analysis the time-resolved velocity centroids of individual transmission spectra show unambiguous evidence of rotation, with a best-fit velocity of 10.0 (+2.4 -2.0) km/s, consistent with the value of vrot derived from the shape of the average Balmer line transmission spectrum. Our observations and analysis confirm the power of high signal-to-noise, time resolved transmission spectra to measure the velocity structures in exoplanet atmospheres. The large rotational and wind velocities we measure highlight the need for more detailed 3D global climate simulations of the rareed upper-atmospheres of ultra-hot gas giants.

Read more: Cauley et al. 2021, AJ, 161, 152
