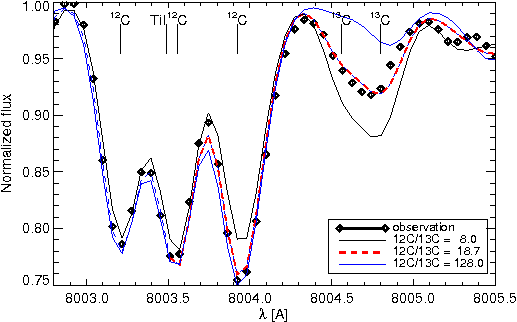
We embarked on a high-resolution optical spectroscopic survey of bright Transiting Exoplanet Survey Satellite (TESS) stars around the Northern Ecliptic Pole (NEP), dubbed the Vatican-Potsdam-NEP (VPNEP) survey. Our NEP coverage comprises 1067 stars, of which 352 are bona fide dwarf stars and 715 are giant stars, all cooler than spectral type F0 and brighter than V=8.5. Our aim is to characterize these stars for the benefit of future studies in the community. We analyzed the spectra via comparisons with synthetic spectra. Particular line profiles were analyzed by means of eigen-profiles, equivalent widths, and relative emission-line fluxes (when applicable). Two R=200 000 spectra were obtained for each of the dwarf stars with the Vatican Advanced Technology Telescope (VATT) and the Potsdam Echelle Polarimetric and Spectroscopic Instrument (PEPSI), with typically three R=55 000 spectra obtained for the giant stars with STELLA and the STELLA Echelle Spectrograph (SES). Combined with V-band magnitudes, Gaia eDR3 parallaxes, and isochrones from the Padova and Trieste Stellar Evolutionary Code, the spectra can be used to obtain radial velocities, effective temperatures, gravities, rotational and turbulence broadenings, stellar masses and ages, and abundances for 27 chemical elements, as well as isotope ratios for lithium and carbon, line bisector spans, convective blue-shifts (when feasible), and levels of magnetic activity from Halpha, Hbeta, and the Ca II infrared triplet. In this initial paper, we discuss our analysis tools and biases, presenting our first results from a pilot sub-sample of 54 stars (27 bona-fide dwarf stars observed with VATT+PEPSI and 27 bona-fide giant stars observed with STELLA+SES) and making all reduced spectra available to the community.

Read more: Strassmeier et al. 2023, A&A, 671, A7 (arXiv:2302.01794)
Press release: To new worlds with quantitative spectroscopy
