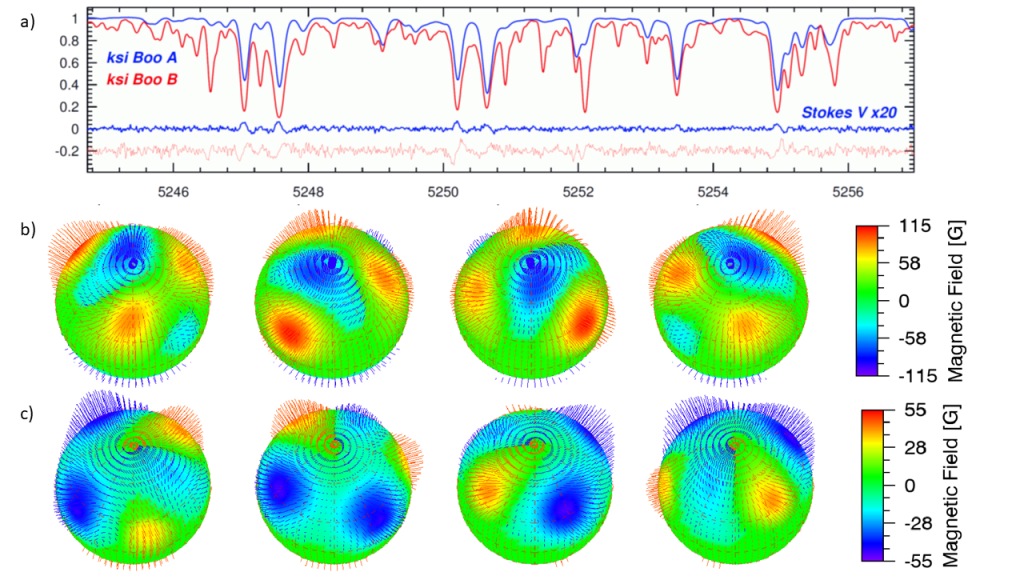
A magnetic-field surface map for both stellar components of the young visual binary ksi Boo AB (A: G8V, B: K5V) is presented. Employed are high resolution Stokes-V spectra obtained with the Potsdam Echelle Polarimetric and Spectroscopic Instrument (PEPSI) at the Large Binocular Telescope (LBT). Stokes V line profiles are inverted with our iMAP software and compared to previous inversions. We employed an iterative regularization scheme without the need of a penalty function and incorporated a three-component description of the surface magnetic-field vector. The spectral resolution of our data is 130,000 (0.040-0.055A) and have signal-to-noise ratios (S/N) of up to three thousand per pixel depending on wavelength. A singular-value decomposition (SVD) of a total of 1811 spectral lines is employed for averaging Stokes-V profiles. Our mapping is accompanied by a residual bootstrap error analysis. Magnetic flux densities of the radial field component of up to plus/minus 115 ± 5 G were reconstructed for ksi Boo A while up to plus/minus 55 ± 3G were reconstructed for ksi Boo B. ksi Boo A’s magnetic morphology is characterized by a very high latitude, nearly polar, spot of negative polarity and three low-to-mid latitude spots of positive polarity while ksi Boo B’s morphology is characterized by four low-to-mid latitude spots of mixed polarity. No polar magnetic field is reconstructed for the cooler ksi Boo B star. Both our maps are dominated by the radial field component, containing 86 and 89 percent of the magnetic energy of ksi Boo A and B, respectively. We found only weak azimuthal and meridional field densities on both stars (plus/minus 15-30 G), about a factor two weaker than what was seen previously for ksi Boo A. The phase averaged longitudinal field component and dispersion is +4.5 ± 1.5G for ksi Boo A and -5.0 ± 3.0 G for ksi Boo B.
Read more: K. G. Strassmeier, T. A. Carroll, & I. V. Ilyin 2023, A&A, 674, 118; (arXiv 2305.07470)