Category Archives: Publications

Lithium in T Corona Borealis

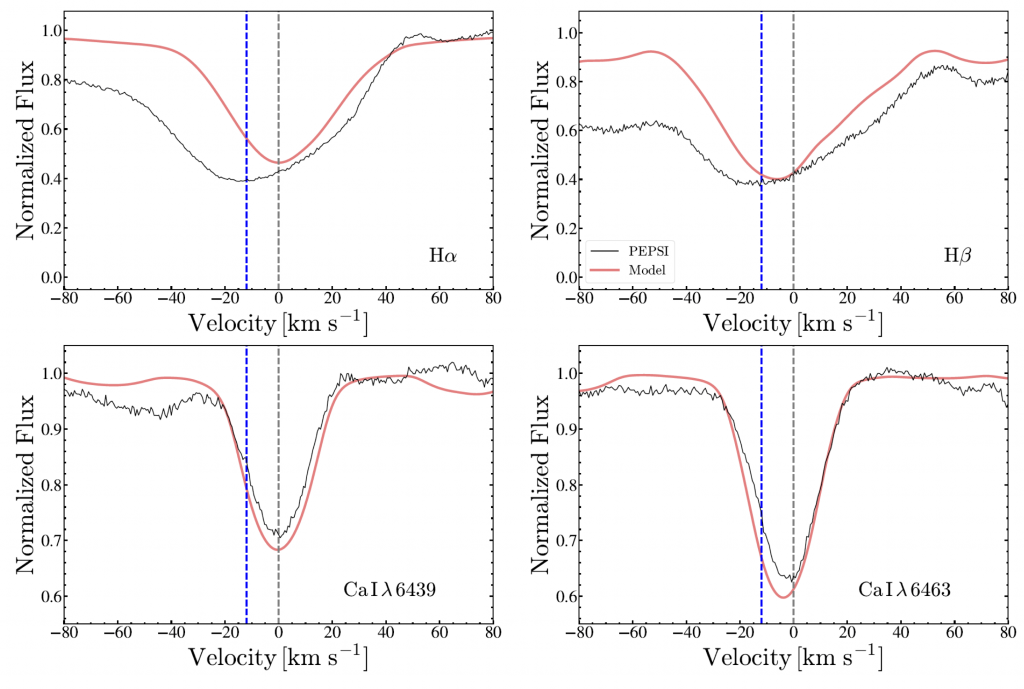
T Coronae Borealis is a recurrent, symbiotic nova system currently in quiescence between its periodic ≍80 yr cycle of eruptions. Observations during inter-outburst epochs provide an opportunity to study properties of the accretion disk and the M red giant. Here we present new irradiated (blackbody veiling) models, incorporating modern molecular opacities and line lists, of spectra derived from high-resolution (22,000 ≲ R ≲ 120,000) optical echelle observations obtained at two epochs, one prior to and one post the 2015 rebrightening event at similar spectroscopic system phase. We find a lithium abundance in the secondary at both epochs to be comparable. The non-irradiated (classical) model atmospheres yield a lithium abundance, A(Li) = 1.3 ± 0.1. The irradiated model (veiled) atmospheres, which are likely a better representation of the system in which the white dwarf and accretion disk illuminate the red giant, give A(Li) = 2.4 ± 0.1.
PEPSI spectrum around 6708 Å Li I resonance doublet in T CrB (red line), which is highly broadened by macro-turbulence. The green line is  a classical 1D model atmosphere fit and the blue line an irradiated  model fit. .
Read more: Woodward et al., 2020, AJ, 159, 231

No Consistent Atmospheric Absorption Detected for the Ultra-hot Jupiter WASP-189b

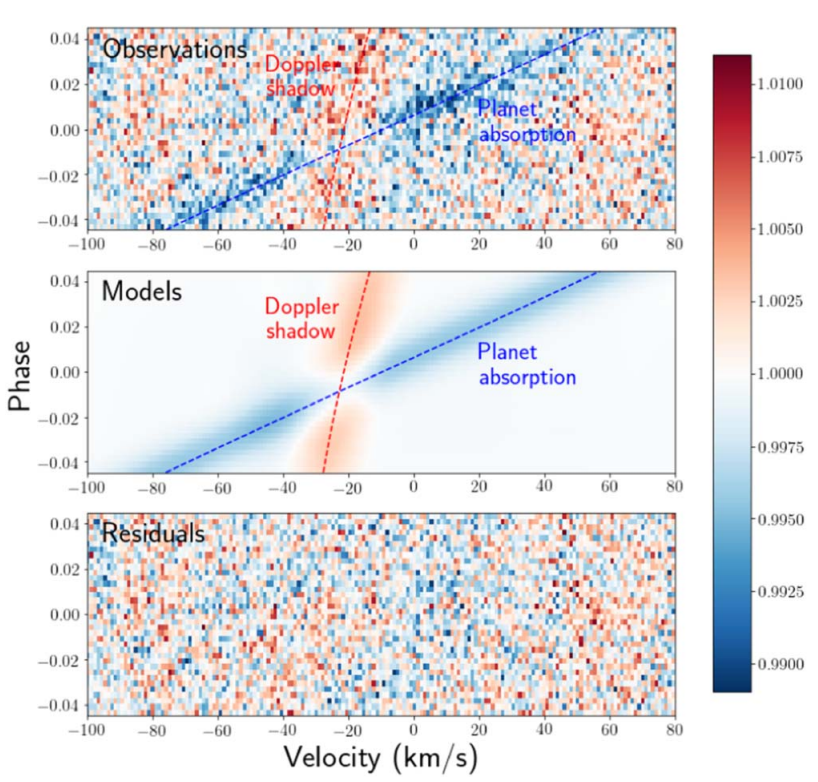
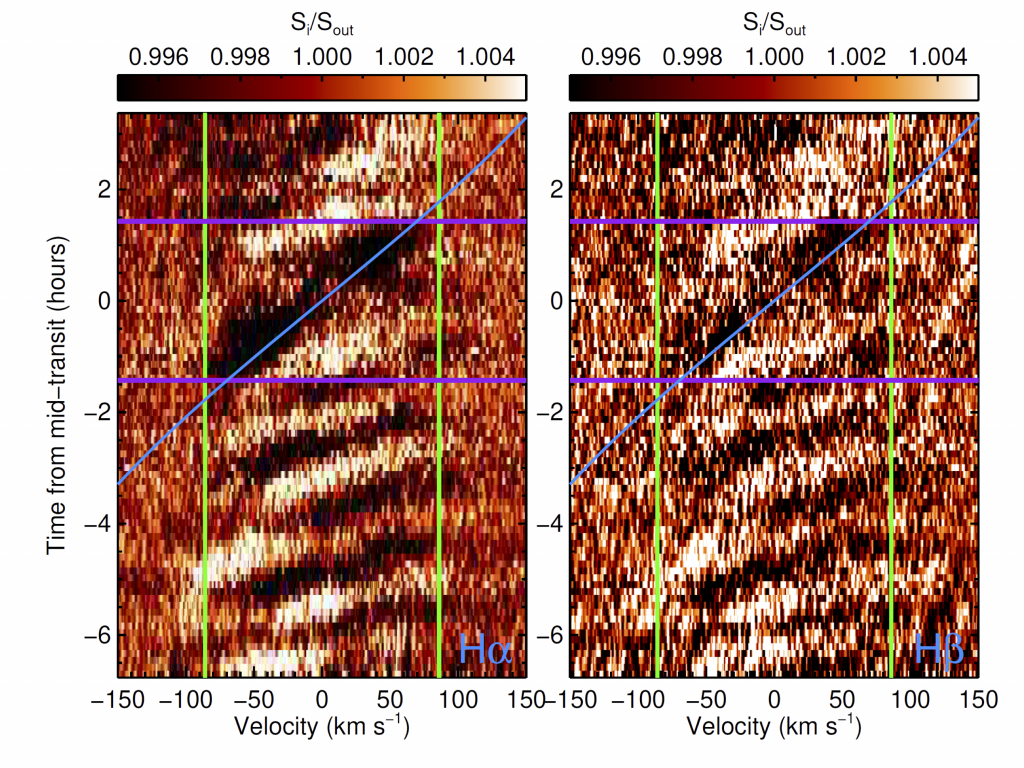
We observed a partial transit of the ultra-hot Jupiter WASP-189 b with PEPSI on the LBT. We detect a highly variable transit signal in multiple atomic transitions, including H-alpha, Fe I, and Mg I. The signal is not consistent with a transiting planetary atmosphere. We suggest instead that the in-transit signal is due to an inhomogeneous stellar surface. Our observations demonstrate the lack of a highly extended atmosphere in common optical atomic tracers. Although WASP-189 is very bright, atmospheric characterization of the planet will be difficult due to the small transit depth and apparently compact atmosphere.


Average transmission spectra (left panels) and time series absorption (right panels) for the lines with detected absorption signatures. Note that the Mg I transmission spectrum is the average of all three triplet members. The vertical gray lines in the time series panels mark the transit contact points. Although there is some significant in-transit variability, no signal consistent with an extended atmosphere around the planet is detect.


Read more: Wilson et al. 2020, Research Notes of the AAS, Volume 4, Issue 4, id.53

Earth as transiting planet

January 2019 featured a total lunar eclipse. The Moon dimmed by a factor of 20,000 (10.75 mag) during totality. Therefore, the light gathering capability of the 11.8 m Large Binocular Telescope (LBT) in Arizona was needed for the observations. Additionally, the high spectral resolution of the Potsdam Echelle Polarimetric and Spectroscopic Instrument (PEPSI) was necessary to separate the expected tiny spectral-line absorptions of the Earth’s atmosphere from the normal solar spectrum at unprecedented spectral resolution and in polarized light. The radial velocities trace a wavelength dependent Rossiter-McLaughlin effect of the Earth eclipsing the Sun as seen from the Tycho crater confirming earlier observations. No line polarization of any spectral-line feature is detected outside nor inside eclipse. This places an upper limit of ≈0.2% on the degree of line polarization during transmission through Earth’s atmosphere and magnetosphere.

Read more: Strassmeier et al., 2020, A&A, 635, 156

AIP press release
LBT press release

Monitoring solar activity with PEPSI

Synoptic Sun-as-a-star observations are carried out with the Potsdam Echelle Polarimetric and Spectroscopic Instrument (PEPSI), which receives light from the Solar Disk-Integration (SDI) telescope. Daily spectra are produced with a high signal-to-noise ratio, providing access to unprecedented quasi-continuous, long-term, disk-integrated spectra of the Sun with high spectral and temporal resolution. We developed tools to monitor and study solar activity on different time-scales ranging from daily changes, over periods related to solar rotation, to annual and decadal trends. Strong chromospheric absorption lines, such as the Ca II H & K λ3934 & 3968 Å lines, are powerful diagnostic tools for solar activity studies, since they trace the variations of the solar magnetic field. Other lines, such as Hα λ6563 Å line and the near-infrared (NIR) Ca II λ8542 Å line, provide additional information on the physical properties in this highly complex and dynamic atmospheric layer. Currently, we work on a data pipeline for extraction, calibration, and analysis of the PEPSI/SDI data. We compare the SDI data with daily spectra from the Integrated Sunlight Spectrometer (ISS), which is part of the Synoptic Long-Term Investigation of the Sun (SOLIS) facility operated by the U.S. National Solar Observatory (NSO). This facilitates cross-calibration and validation of the SDI data.

Read more: Dineva et al. 2020, Astronomy in Focus, IAU XXX General Assembly, Vienna, Austria. Proceedings of the IAU, 2020, pp. 351-353

Download PDF.

A Magnetic Morphology Shift in Old Solar-type Stars

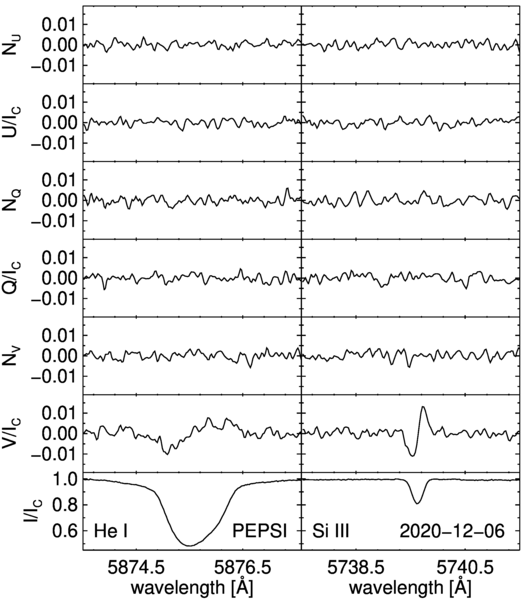
LBT/PEPSI spectropolarimetry tested the hypothesis that the surface magnetic morphology is a crucial component for the spin down of stars. Solar-type stars are born with relatively rapid rotation and strong magnetic fields. Through a process known as magnetic braking, the rotation slows over time as stellar winds gradually remove angular momentum from the system. The rate of angular momentum loss depends sensitively on the magnetic morphology, with the dipole field exerting the largest torque on the star. One hypothesis to explain this reduction in efficiency is a shift in magnetic morphology from predominantly larger to smaller spatial scales. We tested this hypothesis with spectropolarimetric measurements of two stars that sample chromospheric activity levels on opposite sides of the proposed magnetic transition. As predicted, the more active star (HD 100180) exhibits a significant circular polarization signature due to a non-axisymmetric large-scale magnetic field, while the less active star (HD 143761) shows no significant signal.

LSD reconstruction of the Stokes V profiles for HD 100180 (right) and HD 143761 (left).

Read more: Metcalfe et al. 2019, ApJ Letters, 887, 38

Potassium detected on exoplanet atmosphere

We investigated the potassium excess absorption around 7699 Å of the exoplanets HD189733b and HD209458b using high-spectral resolution transit observations acquired with the 2 × 8.4 m Large Binocular Telescope (LBT) and the Potsdam Echelle Polarimetric and Spectroscopic Instrument (PEPSI). For a bandwidth of 0.8 Å, we present a detection >7σ with an absorption level of 0.18 per cent for HD189733b. Applying the same analysis to HD209458b, we can set 3σ upper limit of 0.09 per cent, even though a K-excess absorption was not detected. The investigation suggests that the K feature is less present in the atmosphere of HD209458b than in the one of HD189733b and confirms previous claims that the atmospheres of these two planets must have fundamentally different properties.

Artist’s impression of a hot Jupiter (right) and its cool host star. Credit: AIP/Kristin Riebe.

Read more: Keles et al. 2019, MNRAS, 489, L37

AIP press release
LBT press release

Sun-as-a-star observations of the 2017 August 21 solar eclipse

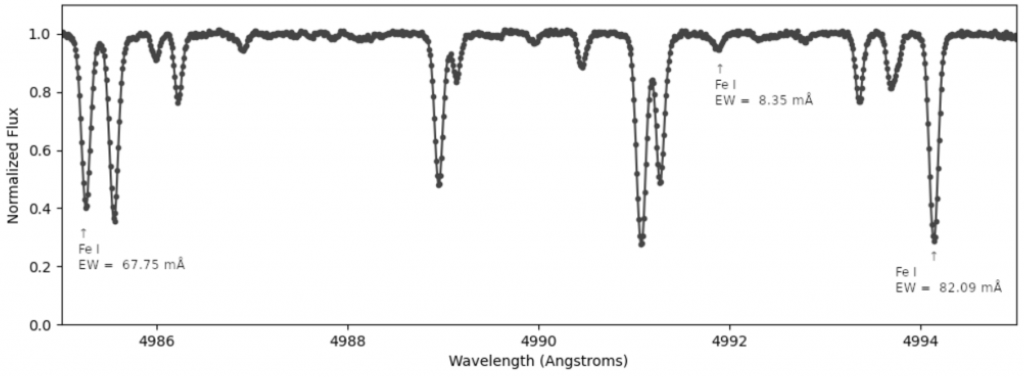
The Potsdam Echelle Polarimetric and Spectroscopic Instrument (PEPSI) is a state-of-the-art, thermally stabilized, fiber-fed, high-resolution spectrograph for the Large Binocular Telescope (LBT) at Mt. Graham, Arizona. During daytime the instrument is fed with sunlight from the 10-millimeter aperture, fully automated, binocular Solar Disk-Integrated (SDI) telescope. The observed Sun-as-a-star spectra contain a multitude of photospheric and chromospheric spectral lines in the wavelength ranges 4200-4800 Å and 5300-6300 Å. One of the advantages of PEPSI is that solar spectra are recorded in the exactly same manner as nighttime targets. Thus, solar and stellar spectra can be directly compared. PEPSI/SDI recorded 116 Sun-as-a-star spectra during the 2017 August 21 solar eclipse. The observed maximum obscuration was 61.6%. The spectra were taken with a spectral resolution of ≈ 250000 and an exposure time of 0.3 s. The high-spectral resolution facilitates detecting subtle changes in the spectra while the Moon passes the solar disk. Sun-as-a-star spectra are affected by changing contributions due to limb darkening and solar differential rotation, and to a lesser extend by supergranular velocity pattern and the presence of active regions on the solar surface. The goal of this study is to investigate the temporal evolution of the chromospheric Na D doublet during the eclipse and to compare observations with synthetic line profiles computed with the state-of-the-art Bifrost code.


Read more: Dineva et al. 2020, IAU Symp. 354, 473

Download PDF.

Surface magnetic activity of the fast-rotating G5 giant IN Comae, central star of the faint planetary nebula LoTr 5

We present a time series of 13 consecutive Doppler images covering six months in 2017 that we used to measure the surface differential rotation with a cross-correlation method. Hitherto unpublished high-precision photometric data from 1989 to 2017 are presented. We applied Fourier-transformation-based frequency analysis to both photometry and spectra. Very high resolution (R ≈ 200 000) spectra were used to update IN Com’s astrophysical parameters by means of spectral synthesis.
Results: Our time-series Doppler images show cool and warm spots coexisting with an average surface temperature contrast of -1000 K and +300 K with respect to the effective temperature. Approximately 8% of the stellar surface is covered with cool spots and ∼3% with warm spots. A consistent cool polar spot is seen in all images. The average lifetime of the cool spots is not much more than a few stellar rotations (one month), while the warm spots appear to live longer (three months) and are mostly confined to high latitudes. We found anti-solar surface differential rotation with a shear coefficient of α = -0.026 ± 0.005 suggesting an equatorial rotation period of 5.973 ± 0.008 d. We reconfirm the 5.9 day rotation period of the cool star from photometry, radial velocities, and Hα line-profile variations. A long-term V-brightness variation with a likely period of 7.2 yr is also found. It appears in phase with the orbital radial velocity of the binary system in the sense that it is brightest at highest velocity and faintest at lowest velocity, that is, at the two phases of quadrature. We redetermine [Ba/Fe], [Y/Fe], and [Sr/Fe] ratios and confirm the overabundance of these s-process elements in the atmosphere of IN Com.

Doppler image for the PEPSI at VATT spectra. The corresponding mid-UT date is 11 March, 2017.


Read more: Kovari et al. 2019, A&A 624, A83

First ZDI with PEPSI

We present a temperature and a magnetic-field surface map of the K2 subgiant of the active binary II Peg. Employed are high resolution Stokes IV spectra obtained with the new Potsdam Echelle Polarimetric and Spectroscopic Instrument (PEPSI) at the Large Binocular Telescope (LBT). Our main result is that the temperature features on II Peg closely correlate with its magnetic field topology. We find a warm spot (350K warmer with respect to the effective temperature) of positive polarity and radial field density of 1.1 kG coexisting with a cool spot (780K cooler) of negative polarity of 2 kG.

Temperature map from four different viewing angles.

Magnetic field map from four different viewing angles.

Read more: Strassmeier, Carroll & Ilyin 2019 A&A, 625, 27 

AIP press release
LBT press release


Revised carbon 12C/13C isotope ratio of α Aurigae

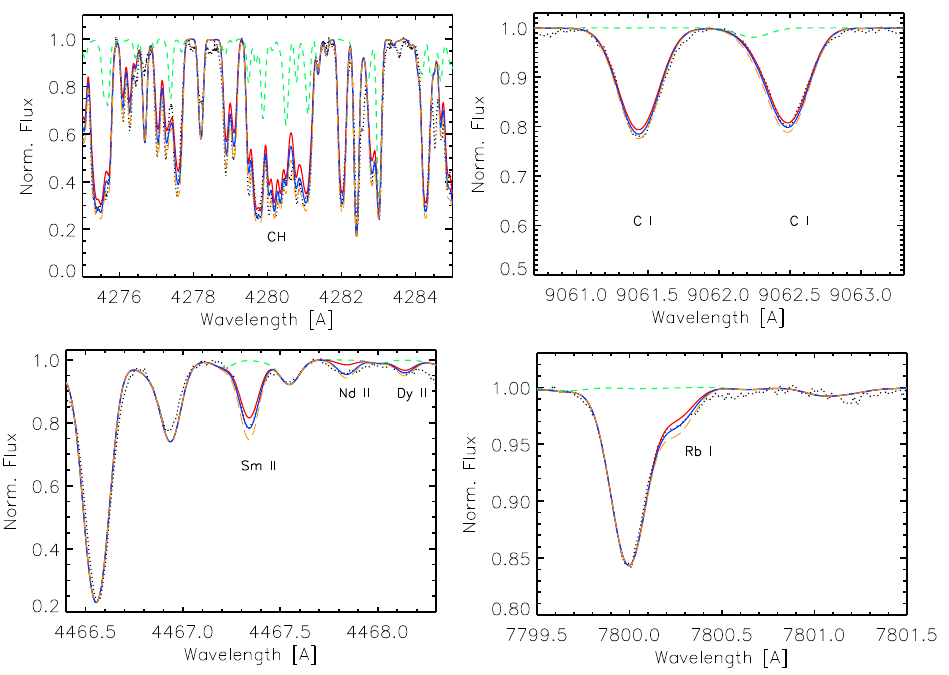
The new measure of the carbon 12C/13C isotope ratio of the primary component of Capella, 17.8 ± 1.9, using high-resolution R ≈ 250 000 spectra obtained with PEPSI at both the Vatican Advanced Technology Telescope (VATT) and the Large Binocular Telescope (LBT) is significantly lower than the previous value of 27 ± 4 but now agrees better with the recent model prediction of 18.8-20.7.

The spectrum synthesis fitting.

Read more: Sablowski et al. 2019 A&A, 622, L11