
News
On the lithium abundance of the visual binary components ksi Boo A (G8V) and ksi Boo B (K5V)
2022-11-07
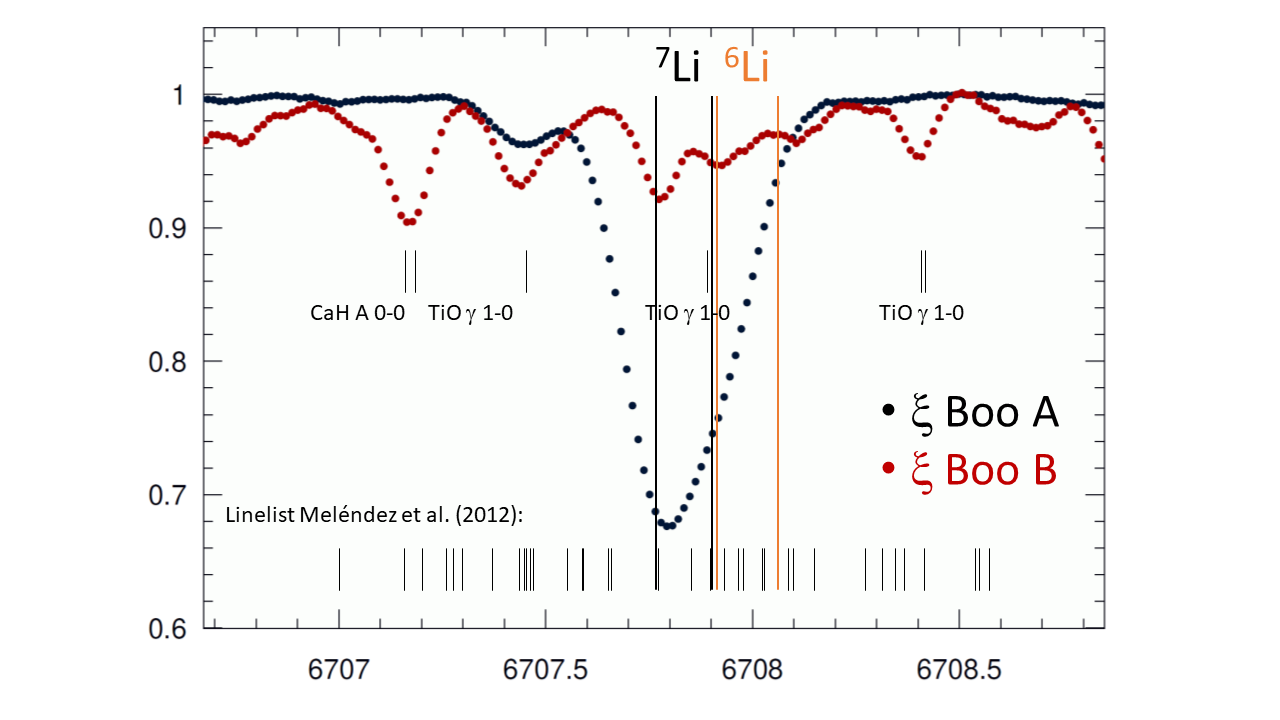
A spectroscopic investigation of the lithium resonance doublet in ξ Boo A and ξ Boo B in terms of both abundance and isotopic ratio is presented. We obtained new R=130 000 spectra with a signal-to-noise ratio (S/N) per pixel of up to 3200 using the 11.8m LBT and PEPSI. From fits with synthetic line profiles based on 1D-LTE MARCS model atmospheres and 3D-NLTE corrections, we determine the abundances of both isotopes. For ξ Boo A, we find A(Li) = 2.40±0.03 dex and 6Li/7Li < 1.5±1.0 % in 1D LTE, which increases to ≈2.45 for the 3D-NLTE case. For ξ Boo B we obtain A(Li) = 0.37±0.09 dex in 1D-LTE with an unspecified 6Li/7Li level. Therefore, no 6Li is seen on any of the two stars. We consider a spot model for the Li fit for ξ Boo B and find A(Li) = 0.45±0.09 dex. The 7Li abundance is 23 times higher for ξ Boo A than the Sun’s, but three times lower than the Sun’s for ξ Boo B while both fit the trend of single stars in the similar-aged M35 open cluster. Effective temperatures are redetermined from the TiO band head strength. We note that the best-fit global metallicities are –0.13±0.01 dex for ξ Boo A but +0.13±0.02 dex for ξ Boo B. Lithium abundance for the K5V benchmark star 61 Cyg A was obtained to A(Li)≈0.53 dex when including a spot model but to ≈0.15 dex without a spot model.
The recurrent nova V3890 Sgr: a near-infrared and optical study of the red giant component and its environment
2022-09-16
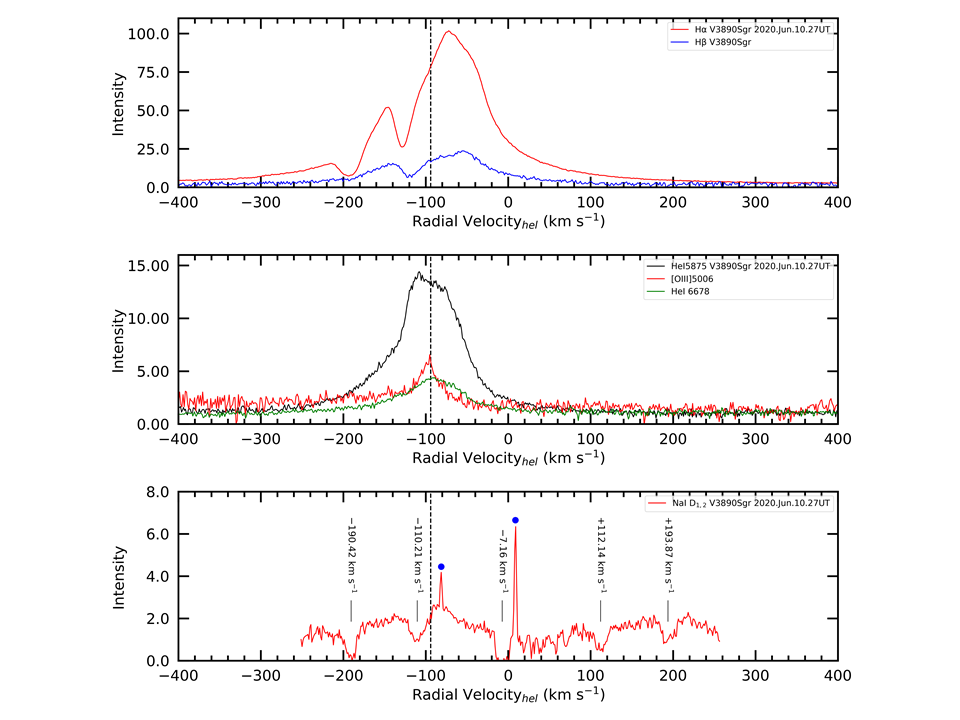
We present an analysis of the red giant component of the recurrent nova V3890 Sgr, using data obtained before and after its 2019 eruption. Its effective temperature is Teff = 3050 ± 200 K for log g = 0.7, although there are modest changes in Teff. There is an overabundance of both carbon (0.20 ± 0.05 dex) and sodium (1.0 ± 0.3 dex) relative to their solar values, possibly the result of ejecta from the 1990 nova eruption being entrained into the red giant photosphere. We find 12C/13C =25 ± 2, a value similar to that found in red giants in other recurrent novae. The spectrum in the region of the Na I D lines is complex, and includes at least six interstellar components, together with likely evidence for interaction between ejecta from the 2019 eruption and material accumulated in the plane of the binary.
Read more: Kaminsky et al. 2022, MNRAS, 517, 6064
Characterization of chromospheric activity based on Sun‑as‑a‑star spectral and disk‑resolved activity indices
2022-07-07
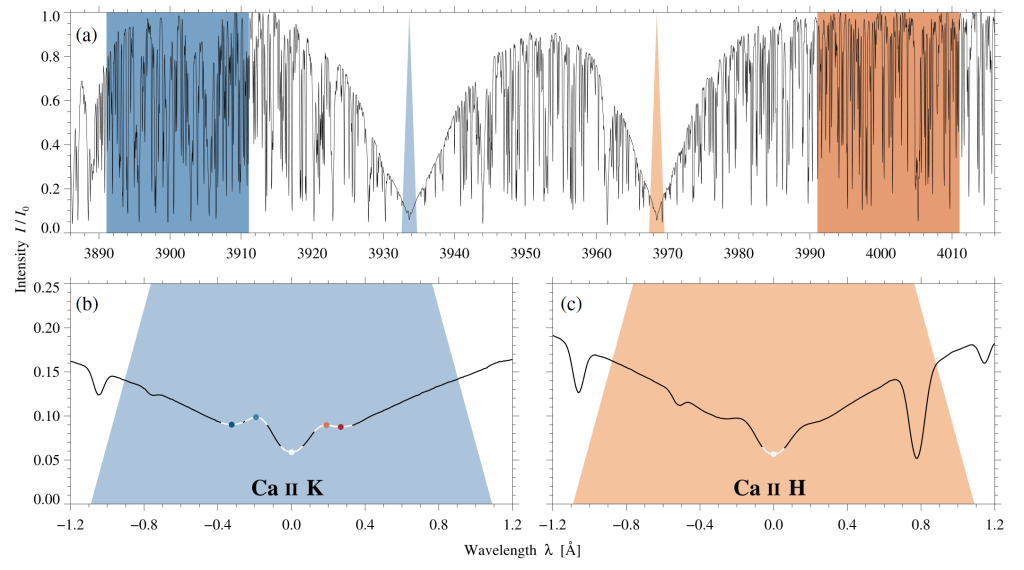
The strong chromospheric absorption lines Ca H & K are tightly connected to stellar surface magnetic fields. Only for the Sun, spectral activity indices can be related to evolving magnetic features on the solar disk. The Solar Disk-Integrated (SDI) telescope feeds the Potsdam Echelle Polarimetric and Spectroscopic Instrument (PEPSI) of the Large Binocular Telescope (LBT) at Mt. Graham International Observatory (MGIO), Arizona, U.S.A. We present high-resolution, high-fidelity spectra that were recorded on 184 & 82 days in 2018 & 2019 and derive the Ca H & K emission ratio, i.e., the S-index. In addition, we compile excess brightness and area indices based on full-disk Ca K line-core filtergrams of the Chromospheric Telescope (ChroTel) at Observatorio del Teide, Tenerife, Spain and full-disk ultraviolet (UV) 1600 Å images of the Atmospheric Imaging Assembly (AIA) on board the Solar Dynamics Observatory (SDO). Thus, Sun-as-a-star spectral indices are related to their counterparts derived from resolved images of the solar chromosphere. All indices display signatures of rotational modulation, even during the very low magnetic activity in the minimum of Solar Cycle 24. Bringing together different types of activity indices has the potential to join disparate chromospheric datasets, yielding a comprehensive description of chromospheric activity across many solar cycles.
Read more: Dineva et al. 2022, AN 343, e23996
The Origin of Weakened Magnetic Braking in Old Solar Analogs
2022-07-04
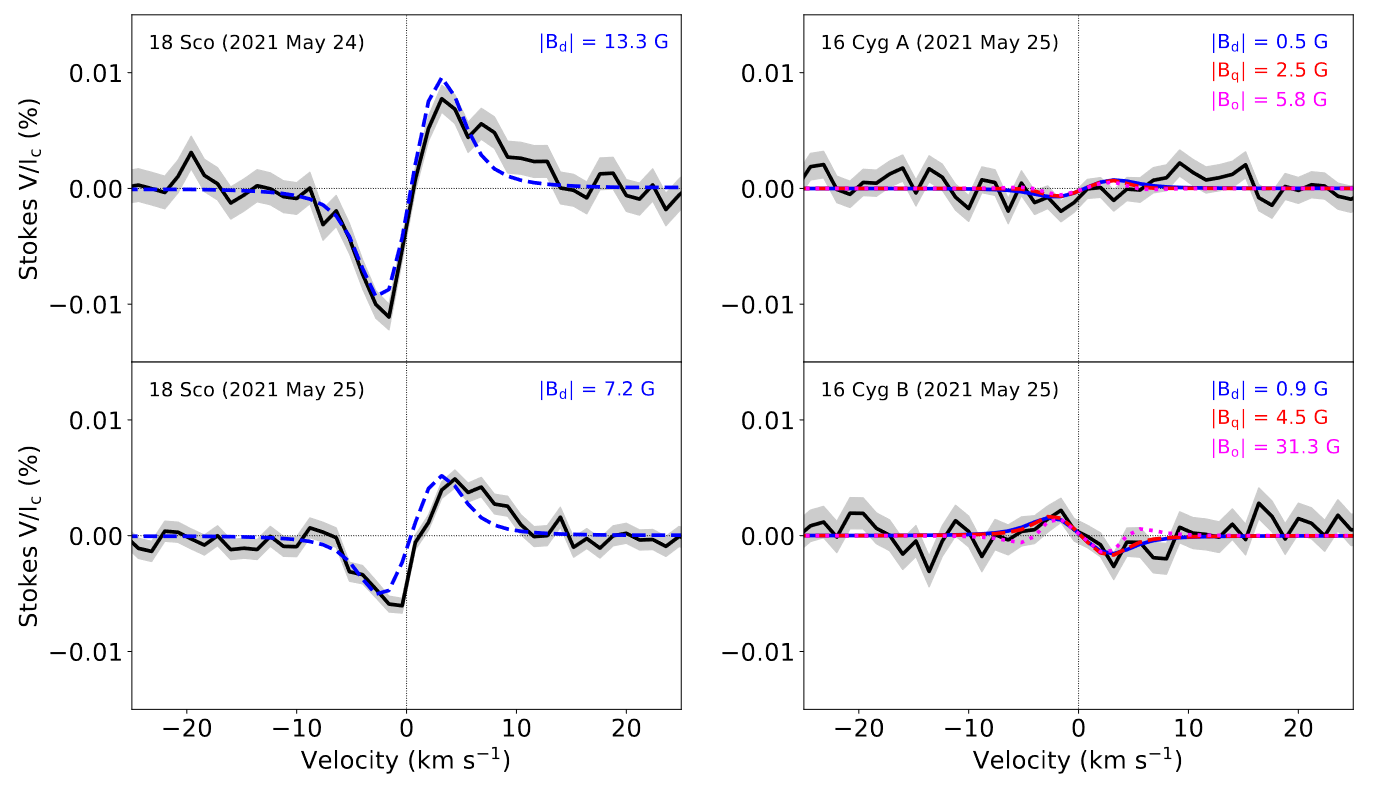
The rotation rates of main-sequence stars slow over time as they gradually lose angular momentum to their magnetized stellar winds. The rate of angular momentum loss depends on the strength and morphology of the magnetic field, the mass-loss rate, and the stellar rotation period, mass, and radius. Previous observations suggested a shift in magnetic morphology between two F-type stars with similar rotation rates but very different ages (88 Leo and ρ CrB). In this Letter, we identify a comparable transition in an evolutionary sequence of solar analogs with ages between 2–7 Gyr. We present new spectropolarimetry of 18 Sco and 16 Cyg A & B from the Large Binocular Telescope, and we reanalyze previously published Zeeman Doppler images of HD 76151 and 18 Sco, providing additional constraints on the nature and timing of this transition.
Read more: Metcalfe et al. 2022, ApJ, 933, L17
An Aligned Orbit for the Young Planet V1298 Tau b
2022-05-16
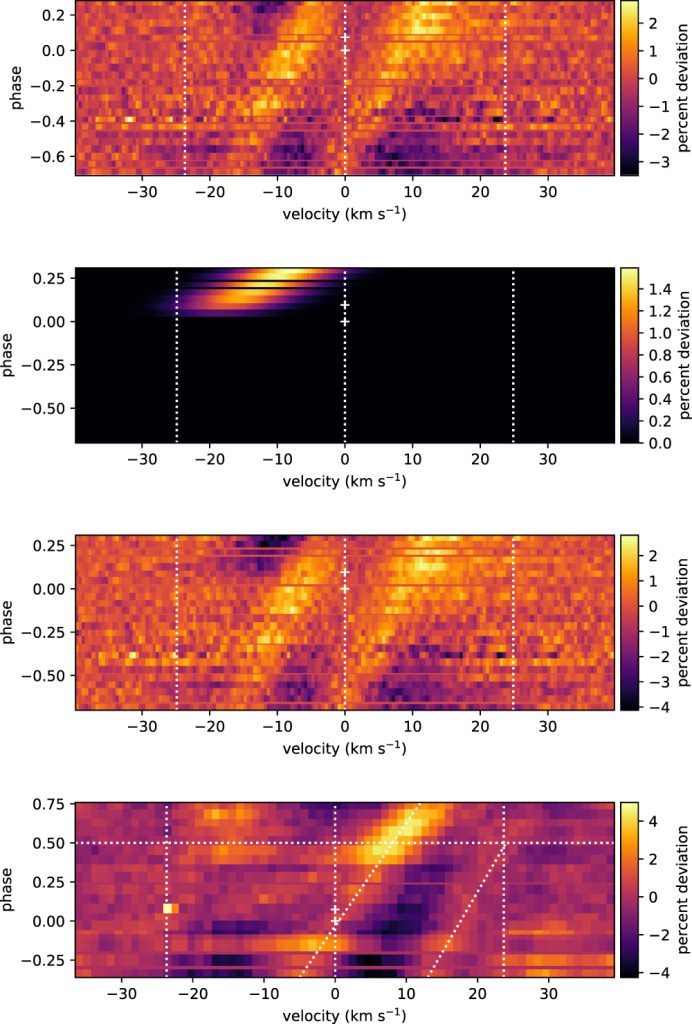
The alignment of planetary orbits with respect to the stellar rotation preserves information on their dynamical histories. Measuring this angle for young planets helps illuminate the mechanisms that create misaligned orbits for older planets, as different processes could operate over timescales ranging from a few megayears to a gigayear. We present spectroscopic transit observations of the young exoplanet V1298 Tau b; we update the age of V1298 Tau to be 28 ± 4 Myr based on Gaia EDR3 measurements. We observed a partial transit with Keck/HIRES and LBT/PEPSI, and detected the radial velocity anomaly due to the Rossiter-McLaughlin effect. V1298 Tau b has a prograde, well-aligned orbit, with λ=4+7−10 deg. By combining the spectroscopically measured vsini⋆ and the photometrically measured rotation period of the host star we also find that the orbit is aligned in 3D, ψ=8+4−7 deg. Finally, we combine our obliquity constraints with a previous measurement for the interior planet V1298 Tau c to constrain the mutual inclination between the two planets to be i mut = 0° ± 19°.
Read more: Johnson et al. 2022, AJ, 163, 247