Pulsations of rapidly oscillating Ap stars and their interaction with the stellar magnetic field have not been studied in the near-infrared (near-IR) region despite the benefits these observations offer compared to visual wavelengths. The main advantage of the near-IR is the quadratic dependence of the Zeeman effect on the wavelength, as opposed to the linear dependence of the Doppler effect.
To test pulsation diagnostics of roAp stars in the near-IR, we investigated the pulsation behaviour of one of the brightest magnetic roAp stars, γ Equ, which possesses a strong surface magnetic field of the order of several kilogauss and exhibits magnetically split spectral lines in its spectra.
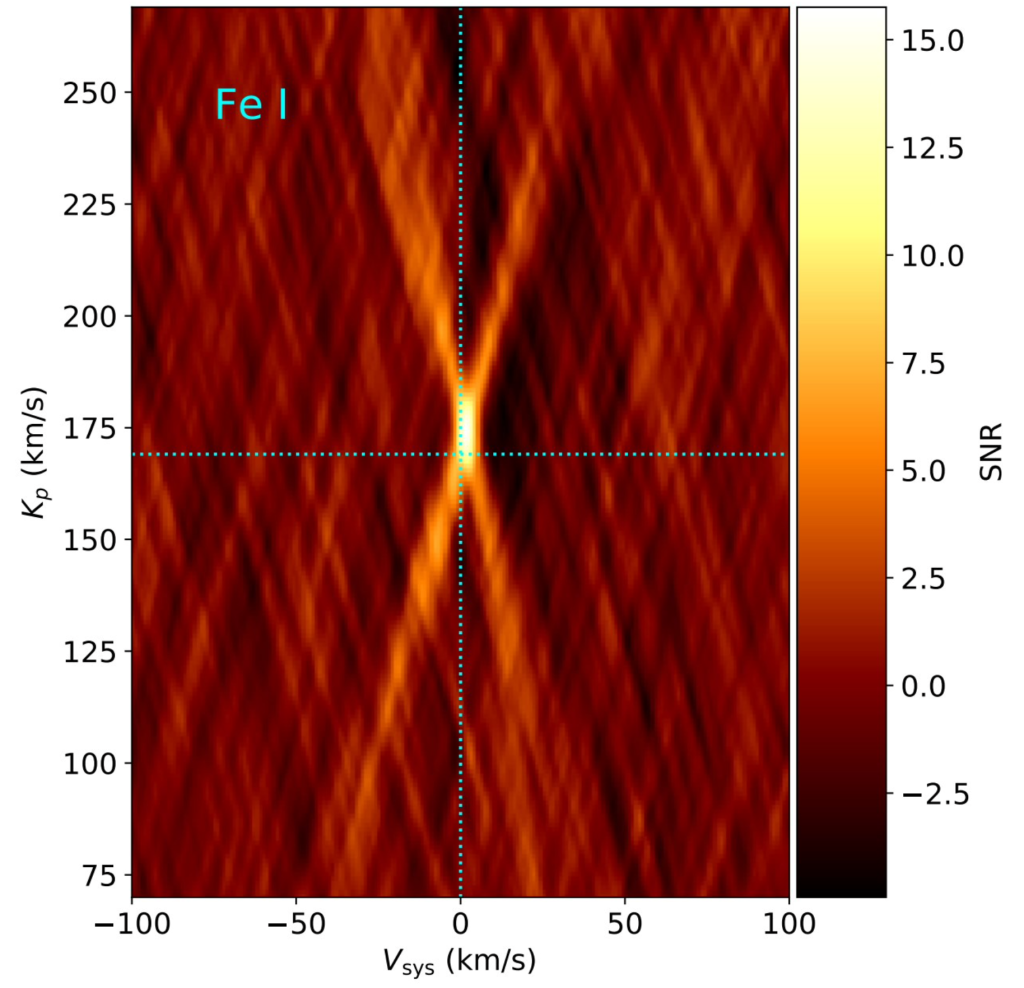
The profile shapes of both studied magnetically split spectral lines in H-band vary in a rather complex manner probably due to a significant decrease in the strength of the longitudinal field component and an increase in the strength of the transverse field components over the last decade. A mean magnetic field modulus of 3.9 kG was determined for the Zeeman triplet Fe I at 1563.63 nm, whereas for the pseudo- doublet Ce III at 1629.2 nm we observe a much lower value of only about 2.9 kG. For comparison, a mean field modulus of 3.4 kG was determined using the Zeeman doublet Fe II at 6249.25 Å in optical PEPSI spectra recorded just about two weeks before the 2022 CRIRES+ observations. Different effects may lead to the differences in the field modulus values. The measurements of the mean magnetic field modulus in different pulsational phase bins suggest a field modulus variability of 32 G for the Zeeman triplet Fe I and 102 G for the pseudo-doublet Ce III.

Read more: Järvinen et al. 2024, A&A 683, A66